27 July 2020 : Laboratory Research
Biochemical Feature of LMO2 Interactome and LMO2 Function Prospect
Wenhao Wang1BC, Yaxin Chen1BC, Ying Chang2AD, Wei Sun1EFG*DOI: 10.12659/MSMBR.924421
Med Sci Monit Basic Res 2020; 26:e924421


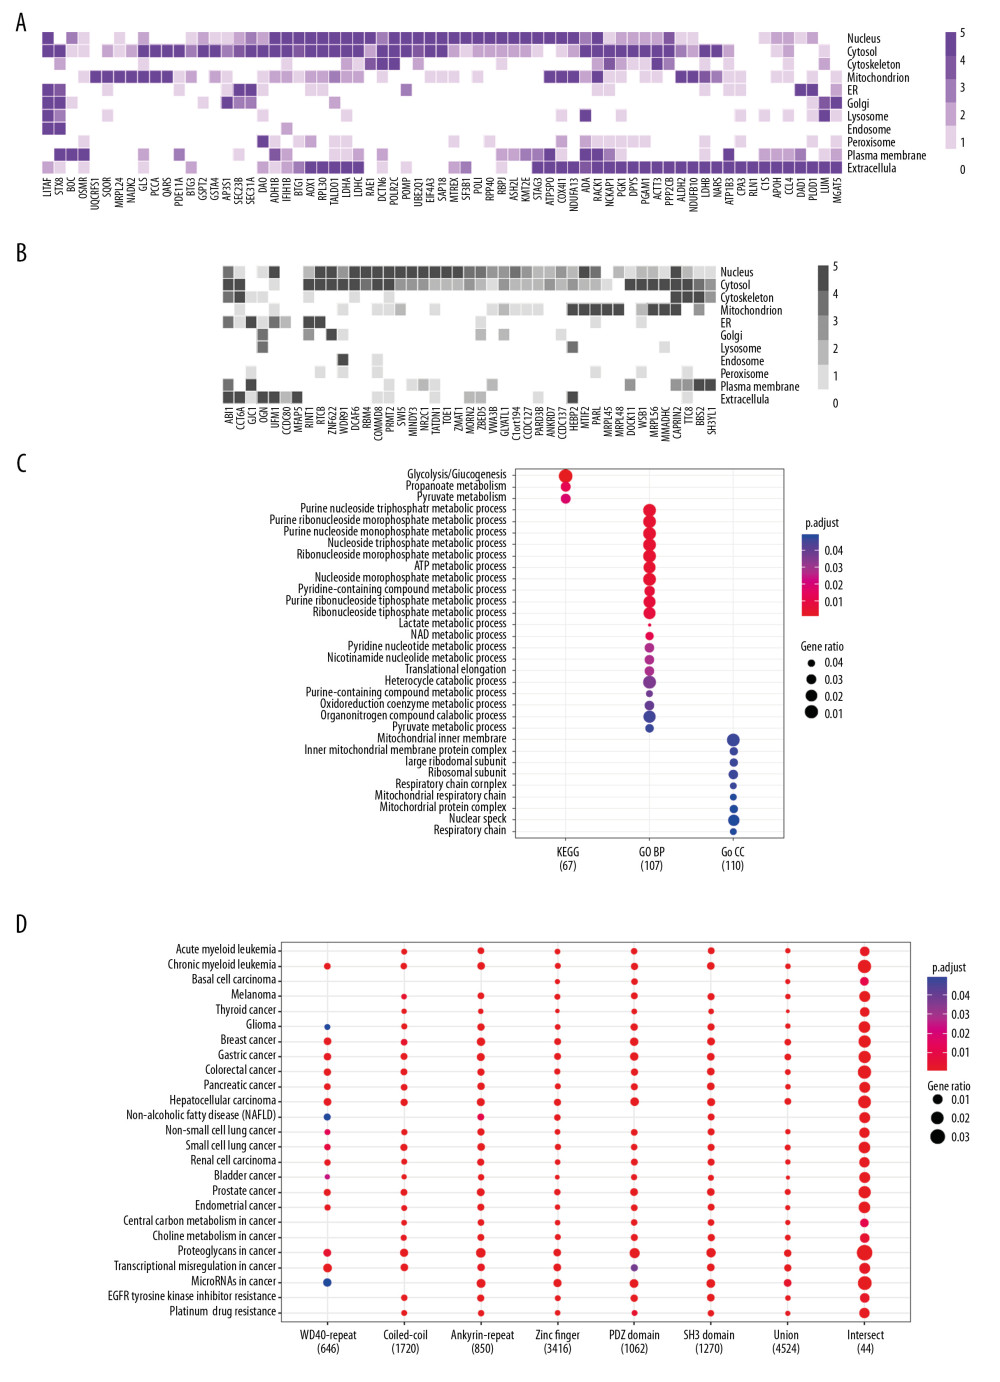
Figure 2 Function prospect of LMO2 via its core interacting partners and extended related genes. (A) Heatmap showing the subcellular distribution of LMO2 core interactome members with KEGG or GO annotation and (B) Heatmap showing the subcellular distribution of LMO2 core interactome members without KEGG or GO annotation. Legend from 5 to 0 indicated the normalized subcellular abundance from highest to none. (C) Dot plot showing the enriched KEGG, GO_BP and GO_CC terms from the enrichment assay on LMO2 core interactome members. Relative information was marked on the plot. (D) Dot plot showing the enriched cancer related KEGG terms from the enrichment assay on extended 6 domain related members. Relative information was marked on the plot. GO – Gene Ontology; KEGG – Kyoto Encyclopedia of Genes and Genomes; BP – biological process; CC – cellular component.