26 December 2020: Database Analysis
Laryngeal Squamous Cell Carcinoma: Potential Molecular Mechanism and Prognostic Signature Based on Immune-Related Genes
Bin-Yu Mo1BCEF, Guo-Sheng Li2BCEF, Su-Ning Huang3DEF, Zhu-Xin Wei2DEF, Ya-Si Su4DEF, Wen-Bin Dai4ADG, Lin Ruan2ADEG*DOI: 10.12659/MSM.928185
Med Sci Monit 2020; 26:e928185


Abstract
BACKGROUND: Immune-related genes (IRGs) are closely related to the incidence and progression of tumors, potentially indicating that IRGs play an important role in laryngeal squamous cell carcinoma (LSCC).
MATERIAL AND METHODS: An RNA sequencing dataset containing 123 samples was collected from The Cancer Genome Atlas. Based on immune-related differentially expressed genes (IRDEGs), a potential molecular mechanism of LSCC was explored through analysis of information in the Gene Ontology (GO) resource and the Kyoto Encyclopedia of Genes and Genomes (KEGG), and protein-protein interactions (PPIs). A regulatory network of transcriptional regulators and IRDEGs was constructed to explore the underlying molecular mechanism of LSCC at the upstream level. Candidates from IRDEGs for signature were screened via univariate Cox analysis and using the least absolute shrinkage and selection operator (LASSO) technique. The IRDEG signature of LSCC was constructed by using a multivariate Cox proportional hazards model.
RESULTS: GO and KEGG analysis showed that IRDEGs may participate in the progression of LSCC through immune-related reactions. PPI analysis demonstrated that, among the IRDEGs in LSCC, the Kininogen 1; C-X-X motif chemokine ligand 10; elastase, neutrophil expressed; and LYZ genes are hub genes in the development of LSCC. At the upstream level, SPI1, SP140, signal transducer and activator of transcription 4, zinc finger E-box binding homeobox, and Ikaros family zinc finger 2 are the hub transcriptional regulators of IRDEGs. The risk score based on the IRDEG signature was able to distinguish prognosis in patients with LSCC and represents an independent prognostic risk factor for LSCC.
CONCLUSIONS: From the perspective of IRGs, we first constructed an IRDEG signature related to the prognosis of LSCC, which can be used as a novel marker to predict prognosis in patients with LSCC.
Keywords: Carcinoma, Squamous Cell, Databases, Nucleic Acid, Immunity, Gene Expression Profiling, gene ontology, Gene Regulatory Networks, Laryngeal Neoplasms, nomograms, Protein Interaction Maps, Reproducibility of Results, Risk Factors, Transcription Factors
Background
Laryngeal squamous cell carcinoma (LSCC) is currently the most common pathological classification of laryngeal carcinoma (LC), accounting for more than 90% of cases [1–6]. Globally, more than 177 000 cases of LC are diagnosed every year, and more than 94 000 deaths from the disease [7]. Currently, treatments such as surgery, radiation therapy, and chemotherapy are used for early-stage LC [8,9], with favorable effects on survival [10–12]. However, more than two-thirds of patients are diagnosed with LC when the disease is already at an advanced stage [13–16]. This delay facilitates the growth and spread of LC cells [17], posing challenges for successful treatment of the disease.
Several pathogenic factors and mechanisms have been proposed for LC. Previous research has found that the incidence and development of it may be related to multiple risk factors, such as drinking [18–20], smoking [13], asbestos exposure [21], and human papillomavirus infection [22]. The mechanism may involve multiple molecules (such as MYC Target 1 [23],
The immune system has been considered to affect the development, growth, and metastasis of tumors. Immune-related genes (IRGs) are considered to be relevant to tumor prognosis. For example, high expression of
High-throughput sequencing technologies are widely used in cancer multi-omics. In this study, we combined high-throughput data from public databases and published studies to explore the potential molecular mechanism of development of LSCC and to identify a prognostic signature based on IRGs to assist in clinical screening and treatment of LSCC.
Material and Methods
COLLECTION OF SAMPLE DATA AND IRGS:
The RNA sequencing (RNA-Seq) dataset from The Cancer Genome Atlas (TCGA) was obtained through the Genomic Data Commons Data Portal database (
DIFFERENTIAL EXPRESSION ANALYSIS:
RNA-Seq count data were input into R (v3.6.1), and through the edgeR package [34], differentially expressed genes (DEGs) that had a log2-fold change of 2 or more and an adjusted P<0.05 were selected for further study. Genes were identified as upregulated (up-DEGs) if they showed a log2-fold change of 2 or more, while genes with a log2 fold change less than −2 were considered downregulated (down-DEGs). The same methods were used to screen immune-related differentially expressed genes (IRDEGs), immune-related upregulated DEGs (up-IRDEGs), and immune-related downregulated DEGs (down-IRDEGs).
ANALYSIS OF THE POTENTIAL MOLECULAR MECHANISM OF IRDEGS:
Gene Ontology (GO) and Kyoto Encyclopedia of Genes and Genomes (KEGG) pathway enrichment analyses of up-IRDEGs and down-IRDEGs were performed using the clusterProfiler package [35] in R (v3.6.1). GO terms and KEGG signaling pathways were then filtered by identifying those that simultaneously satisfied the following 3 conditions: (1) adjusted P<0.05; (2) q<0.05; and (3) number of enriched genes ≥5. The STRING database (https://string-db.org/) was used for analysis of protein-protein interactions (PPIs) of up-IRDEGs and down-IRDEGs. The minimum required interaction score for a PPI was set at 0.7 in the STRING database, which is considered by the database as high confidence. The CytoHub plug-in in Cytoscape software (v3.7.2) was applied to screen for hub genes, and the hub genes of up-IRDEGs and down-IRDEGs were identified according to the degree algorithm.
TRANSCRIPTIONAL REGULATOR (TR) PREDICTION FOR IRDEGS AND CONSTRUCTION OF TR-MEDIATED REGULATORY NETWORK:
To further understand the potential molecular mechanisms of up-IRDEGs and down-IRDEGs in LSCC, we attempted to explore the upstream regulation mechanism of these genes through the correlation between the genes and transcriptional regulators (TRs). TRs for genes were predicted using Epigenetic Landscape In Silico (Lisa, http://lisa.cistrome.org/), a bioinformatics analysis tool [36] that contains a large amount of H3K27ac ChIP-seq data from Homo sapiens. We predicted TRs related to up-IRDEGs and down-IRDEGs with the Lisa tool and selected TRs with P<0.01. Pearson coefficients of expression levels of TRs and IRDEGs were calculated in R, while the TR-IRDEG regulatory network was constructed using Cytoscape.
DEVELOPMENT AND ASSESSMENT OF IRDEG SIGNATURE:
Univariate Cox analysis and least absolute shrinkage and selection operator (LASSO) were used to select the candidates for signature from IRDEGs, and a multivariate Cox proportional hazards model was applied to construct the IRDEG signature of LSCC based on candidate IRDEGs (Figure 1). Using univariate Cox analysis, IRDEGs related to the survival of patients with LSCC (P<0.05) were identified and named as preliminary candidate IRDEGs. Then, based on the LASSO regression analysis, which can quickly and effectively extract important variables from many variables, secondary candidate IRDEGs were obtained from the preliminary candidate IRDEGs. Eventually, through the multivariate Cox proportional hazard model, some of the secondary candidate IRDEGs were used to construct the IRDEG signature of LSCC.
Curves for receiver operating characteristics (ROCs) and survival analysis (Kaplan-Meier) were used to evaluate the relationship between the IRDEG signature and the effects on screening and prognosis, respectively. Univariate and multivariate Cox regression analyses were used to identify factors related to independent prognoses in the IRDEG signature and clinical parameters. Development and assessment of the IRDEG signature were completed in R with the help of the glmnet [37], survival, and survivalROC package [38].
RELATIONSHIP BETWEEN RISK SCORE OF IRDEG SIGNATURE AND IMMUNE INFILTRATION LEVEL:
The Tumor IMmune Estimation Resource (TIMER,
APPLICATION OF IRDEG SIGNATURE:
Combining the IRDEG signature and the clinical parameters related to the independent prognosis of LSCC, a nomogram was constructed to quantify the risk of LSCC in individuals in a clinical environment. A calibration curve was used to detect the difference between the predicted and actual survival rates in the nomogram. The concordance index (C-index; range 0–1) was used to objectively evaluate the predictive power of the signature; the larger the C-index, the better the predictive power of the signature. Construction and verification of the nomogram were performed in R.
STATISTICAL ANALYSIS:
Except for differential expression analysis, for which original counts should be used, the RNA-Seq data used in the rest of the analysis were log2 (counts+1) converted data. All statistical analyses were performed in R.
The main processes in the present study are shown in Figure 1. Unless otherwise specified, P<0.05 for a difference was considered statistically significant.
Results
IDENTIFICATION OF DEGS AND IRDEGS IN LSCC:
After filtering, 4274 DEGs were included: 2990 up-DEGs and 1284 down-DEGs. Among the 1811 IRGs, there were 302 IRDEGs, including 224 up-IRDEGs and 78 down-IRDEGs. Supplementary Figure 1 shows the expression of DEGs and IRDEGs in LSCC.
GO, KEGG, AND PPI ANALYSES OF IRDEGS:
To analyze the potential molecular mechanism of LSCC, we conducted GO, KEGG, and PPI analyses of IRDEGs.
GO analysis was performed on 224 up-IRDEGs and 78 down-IRDEGs. Among up-IRDEGs, the most common biological terms were “complement activation, classical pathway” (“biological process”), “blood microparticle” (“cell component”), and “antigen binding” (“molecular function”) (Figure 2A–2C). For down-IRDEGs, the most common biological process, cell component, and molecular function terms were “antimicrobial humoral response,” “azurophil granule lumen,” and “receptor ligand activity,” respectively (Supplementary Figure 2A–2C). Table 1 shows the 4 most enriched terms among the 3 types of terms.
KEGG analysis results showed that the most enriched KEGG pathway for both up-IRDEGs (Figure 3) and down-IRDEGs (Supplementary Figure 3) was the “cytokine-cytokine receptor interaction.” The 4 most enriched pathways for up-IRDEGs and down-IRDEGs are shown in Figure 3, Supplementary Figure 3, and Table 1. The GO and KEGG analyses show that the biological terms enriched in IRDEGs and the KEGG signaling pathway are closely related to immunity. In fact, these results are not surprising, given that the IRDEGs used for KEGG analysis were originally genes closely related to immunity.
The results of the PPI analysis and the degree algorithm showed that in up-IRDEGs, Kininogen 1 (KNG1) and C-X-C motif chemokine ligand 10 (CXCL10) were hub genes in the development of LSCC, while in down-IRDEGs, the hub genes were elastase, neutrophil expressed (ELANE) and lysozyme (LYZ). Figure 4A and 4B, respectively, show the interaction between the first 30 up-IRDEGs and down-IRDEGs obtained with the Degree algorithm.
CONSTRUCTION OF A TR-MEDIATED REGULATORY NETWORK:
Based on the prediction results from the Lisa tool, we screened 103 up-TRs related to up-IRDEGs with a threshold of P<0.01. To reduce false positives in TR prediction results, we conducted a correlation analysis on the 96 up-TRs included in up-IRDEGs and RNA-Seq and finally selected 15 real up-TRs and 50 up-IRDEGs with Pearson correlation coefficients >0.5 and P<0.05 for constructing up-TR-IRDEGs. The results showed that SPI1, SP140, and signal transducer and activator of transcription 4 (STAT4) were likely to be the hub TRs regulating up-IRDEGs (Figure 5A).
In the same way, we screened 159 down-TRs, 147 of which were included in the RNA-Seq dataset used in this study. Finally, we selected 17 real down-TRs and 24 down-IRDEGs with correlation coefficients >0.5 to construct down-TRs-IRDEGs. The results indicated that zinc finger E-box binding homeobox (ZEB1) and Ikaros family zinc finger 2 (IKZF2) may be important TRs in regulating down-IRDEGs (Figure 5B).
CONSTRUCTION OF IRDEGS SIGNATURE:
Through univariate Cox analysis, 30 preliminary candidate IRDEGs related to the survival of patients with LSCC were obtained from 302 IRDEGs, as shown in Supplementary Figure 4. Based on LASSO regression analysis and selecting the largest lambda with an average error within 1 standard deviation, 14 secondary candidate IRDEGs for construction of an IRDEG signature were selected from as many as 30 preliminary IRDEGs (Supplementary Figure 5). In total, 14 secondary candidate IRDEGs – beta cellulin (BTC), EPO, fibroblast growth factor (FGF)19, FGF5, gastrin (GAST), immunoglobulin heavy chain variable (IGHV)3–7, IGHV6–1, interleukin 13 receptor subunit alpha 2 (IL13RA2, retinol binding protein 1 (RBP1), RAR related orphan receptor C (RORC), semaphoring 6C (SEMA6C), TNR receptor superfamily member 4 (TNFRSF4), TUBB3, and urocortin (UCN) – were used to construct the IRDEG signature. Finally, we used the multivariate Cox proportional hazards model to construct the IRDEG signature of LSCC. The final IRDEG signature contained 9 secondary candidate IRDEGs for LSCC. As shown in Table 2, of the 9 IRDEGs, 7 (FGF19, GAST, IGHV3–7, IL13RA2, RBP1, TUBB3, UCN) were highly expressed in LSCC, while IL13RA2, RBP1, and TUBB3 are prognostic risk factors for patients with LSCC (hazard ratio [HR] >1 and 95% confidence interval [CI] do not contain 1). Of the 9 IRDEGs, BTC and RORC are expressed at low levels in LSCC and BTC is a risk factor for patients with LSCC, while RORC is a prognostic protective factor (HR <1 and 95% CI do not contain 1). The 9 genes included in the IRDEG signature as well as the coefficients of each gene are listed in Table 2. The product of the expression value of each gene and the gene’s corresponding coefficient is the contribution of the gene to the risk score, and the sum of the contribution of all genes is the risk score, and we performed a risk score calculation for 111 LSCC samples.
VALIDATION OF IRDEG SIGNATURE:
To evaluate the screening and prognostic effects of the signature in LSCC prognosis, patients with LSCC were divided into high- and low-risk groups according to scores higher or lower than the median risk score (0.859).
In terms of screening, the ROC curve showed that the risk score calculated according to the signature was the best measure for determining the survival of patients with LSCC, with a higher area under the curve than any clinical parameter (age, sex, neoplasm histologic grade, stage, tumor stage, node stage; Figure 6A) and any single gene included in the IRDEG signature (Figure 6B). Moreover, we also compared the performance of the signature to potential markers related to the prognosis of LSCC identified in research recently added to PubMed (published between January 1, 2020 and May 15, 2020), while 9 of the potential markers – activated leukocyte cell adhesion molecular (ALCAM) [39], ATM [40], BAF chromatin remodeling complex subunit (BCL11A) [41], B-cell lymphoma 2 (BCL-2) [42], desmoglein 2 (DSG2) [43], epidermal growth factor receptor (EGFR) [44], FGFR1 [45], homeobox A13 (HOXA13) [46], insulin like growth factor 1 receptor (IGF-1R) [47] – were included in the RNA-Seq data used in this study. Compared with any gene from these 9 potential prognostic markers, the risk score based on the IRDEG signature showed the best ability to screen for prognosis in patients with LSCC (Figure 6C).
In terms of prognosis, the OS rate for the high-risk group was significantly lower than that for the low-risk group (Figure 6D, P=1.234e-12). Moreover, the risk curve showed that the majority of patients with LSCC who died were those with a higher risk score, whereas there were significantly fewer deaths in the group with low-risk scores (Figure 7A). Figure 7B shows the expression of the 9 IRDEGs in the signature in the high- and low-risk groups.
In addition, we used Cox regression analysis to explore prognostic factors in LSCC. The results of univariate and multivariate Cox regression analysis demonstrated that the risk score based on the IRDEG signature can be considered a risk factor for the independent prognosis of LSCC (Figure 8A, 8B). In terms of risk of death, the risk for men with LSCC was 0.432 times that for women, whereas the node stage of the tumor was a risk factor related to the prognosis of LSCC (Figure 8B).
RELATIONSHIP BETWEEN IRDEG SIGNATURE AND CLINICAL PARAMETERS IN PATIENTS WITH LSCC:
To explore the clinical significance of IRDEGs in the signature of LSCC, we studied the expression of each IRDEG in the signature and its relationship with clinical parameters. Among the 9 IRDEGs included in the signature, BTC and RORC had low levels of expression in LSCC and the remaining 7 genes were highly expressed in LSCC. A Wilcoxon test showed that there were statistically significant differences in expression of 6 of the remaining 7 genes in the LSCC and non-LSCC samples. The exception was IL13RA2 (Figure 9A). Subsequently, based on data from 102 patients with LSCC for whom we had complete clinical information (Supplementary Table 1), we explored the relationship between risk score and expression level of the 9 genes and the clinical parameters in the patients (age, sex, neoplasm histologic grade, stage, and tumor and node stage), and found that the risk score and GAST were related to the neoplasm histologic grade of LSCC (Figure 9B, 9C), while the levels of expression of BTC, RORC, and TUBB3 were related to the age of patients with LSCC (Figure 9D–9F).
In addition, we analyzed the relationship between the IRDEG signature and the infiltration levels of B and CD4 and CD8 T cells; macrophages; neutrophils; and dendritic cells and found that the risk score based on the IRDEG signature was negatively correlated with the level of B-cell immune infiltration (Supplementary Figure 6).
CONSTRUCTION AND VERIFICATION OF NOMOGRAM BASED ON IRDEG SIGNATURE:
To investigate a preliminary application of the IRDEG signature, we constructed a nomogram of it and the clinical parameters related to independent prognosis of LSCC and predicted 1-, 3-, and 5-year survival rates in patients with LSCC (Figure 10A).
The calibration curve revealed that although the 3- and 5-year survival rate predictions by the nomogram were not in good agreement with actual patient survival (data not shown), the 1-year survival rate predictions were close to actual survival (Figure 10B). Moreover, the more objective C-index was 0.777 (standard deviation=0.031), indicating that the nomogram could predict the survival rate with moderate accuracy.
Discussion
According to current research, a number of IRGs are closely related to the incidence and progression of tumors, potentially indicating that IRGs play an important role in cancer [32]. Therefore, new markers for screening and treatment of tumors could be discovered through exploration of and research about IRGs.
Using the RNA-Seq dataset containing 123 samples, we first explored the potential molecular mechanism of LSCC from the perspective of IRGs, and for the first time, constructed an IRDEG signature related to the prognosis of LSCC based on IRGs. Through GO and KEGG analysis, we found, as expected, that IRDEGs may participate in the progression of LSCC through immune-related reactions. PPI analysis identified hub genes among IRDEGs in LSCC. We then constructed a regulatory network of TRs and IRDEGs to explore the underlying molecular mechanism of LSCC at the upstream level. In addition, the risk score based on the IRDEG signature that we constructed did well in distinguishing the prognosis of patients with LSCC. The risk score based on the IRDEG signature was an independent prognostic risk factor for LSCC, indicating that the IRDEG signature can be used as a novel marker to predict prognosis in patients with LSCC.
Initially, we explored the underlying molecular mechanism of LSCC from the perspective of IRGs. To this end, we conducted enrichment and PPI analyses on IRDEGs. In up-IRDEGs, the most common GO terms in biological processes, cellular components, and molecular functions were “complement activation, classical pathway,” “blood microparticle,” and “antigen binding,” respectively, while in down-IRDEGs, the terms were “antimicrobial humoral response,” “azurophil granule lumen,” and “receptor ligand activity,” respectively. The KEGG analysis revealed that the most enriched pathways for both up-IRDEGs and down-IRDEGs was the “cytokine-cytokine receptor interaction.” It is worth mentioning that quite a few GO terms and KEGG signaling pathways enriched in IRDEGs were closely related to tumor progression and immune response [48,49]; this, to a certain extent, indicates that IRDEGs may be involved in immune response, and thus, they participate in the occurrence and progression of LSCC. Through PPI analysis, we found that in up-IRDEGs,
To explore new markers that can be used for the screening and treatment of LSCC, we constructed a signature from 9 IRDEGs (
All the IRDEGs included in the signature other than
To further explore the clinical significance of the IRDEG signature in LSCC, we analyzed the relationship between the signature, clinical parameters, and immune cell infiltration level in patients with LSCC. The results demonstrated that the risk score and the levels of expression of
In this study, although we identified potential molecules involved in LSCC from the perspective of IRGs and established the first IRDEG signature related to the prognosis of the disease, there were several limitations. For example, the sample size was relatively small (n=123), and a study with a larger sample would be needed to verify the results. Moreover, because of the limited sample data, we could not externally verify the IRDEG signature, nor could we identify the relationship between the IRDEG signature and specific treatment methods, such as chemotherapy. Further experimental research is needed to verify the clinical significance and molecular mechanisms of the IRDEG signature in LSCC.
Conclusions
The IRDEG signature constructed in this study had a strong effect on the screening and prognosis of patients with LSCC and it may be considered an independent prognostic factor for use as a new marker in early screening and treatment of LSCC.
Figures
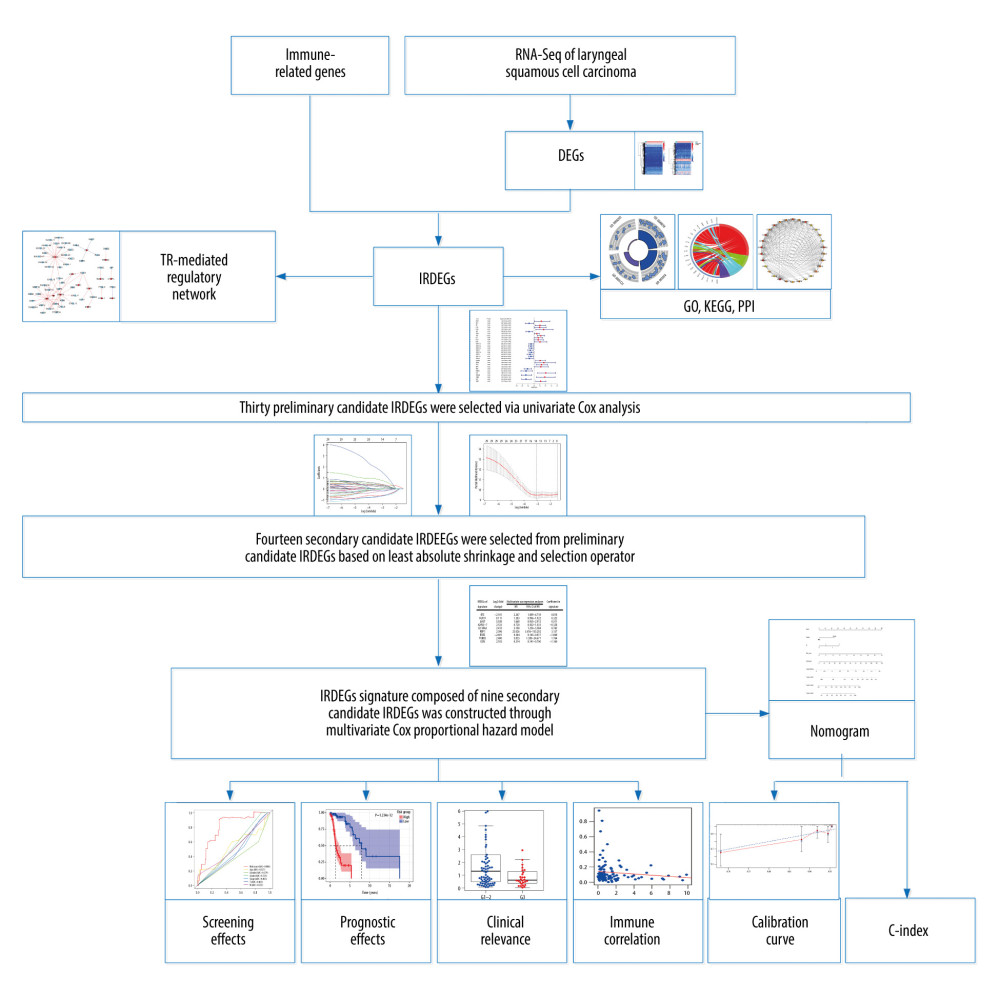 Figure 1. The main processes of this study. DEGs – differentially expressed genes; IRDEGs – immune-related differentially expressed genes; GO – Gene Ontology; KEGG – Kyoto Encyclopedia of Genes and Genomes; PPI – protein–protein interaction; TR – transcriptional regulator; C-index – concordance index.
 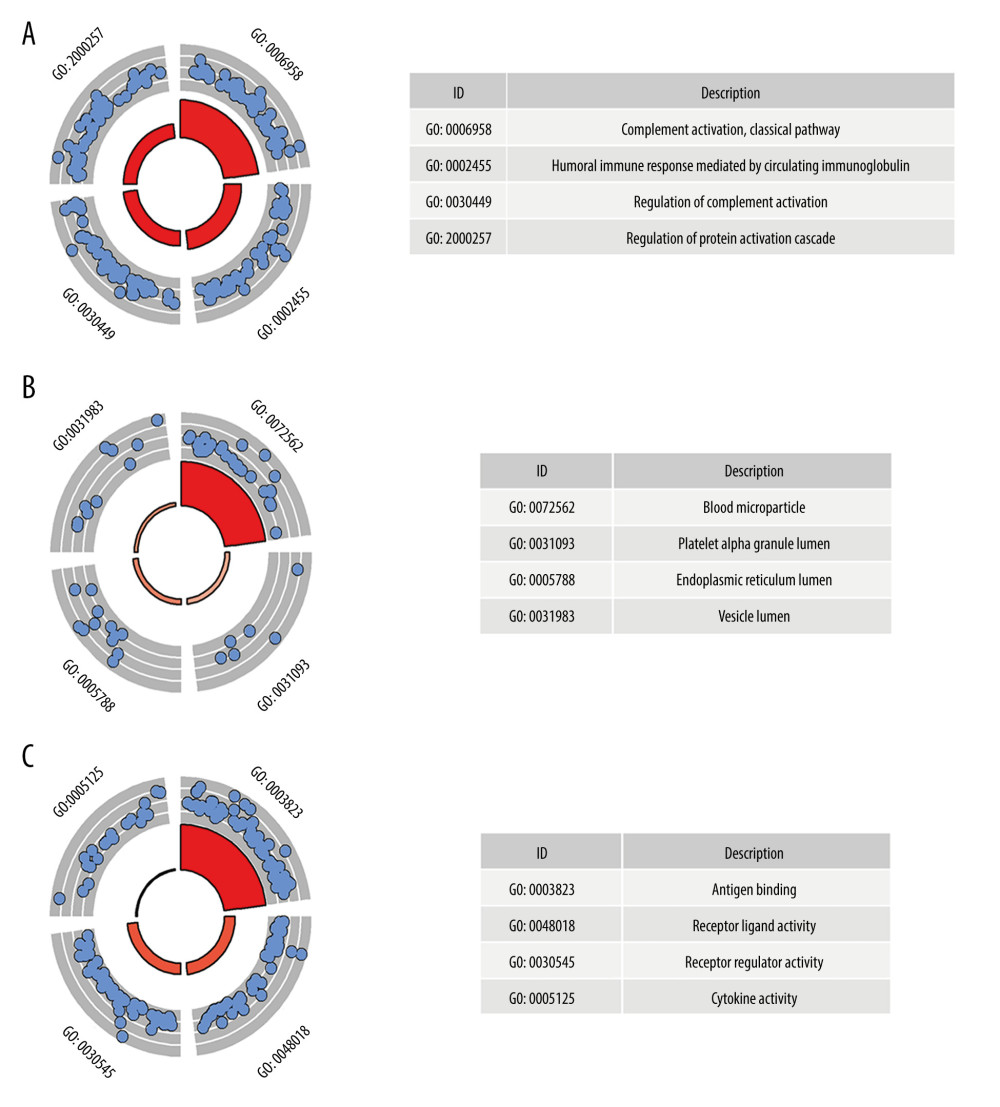 Figure 2. Gene Ontology (GO) analysis for immune-related upregulated differentially expressed genes. (A) Biological process. (B) Cellular component. (C) Molecular function. The blue nodes in the concentric circles represent genes clustered in specific GO terms. The larger size and darker color of the internal departments represent more significant enrichment of GO terms.
 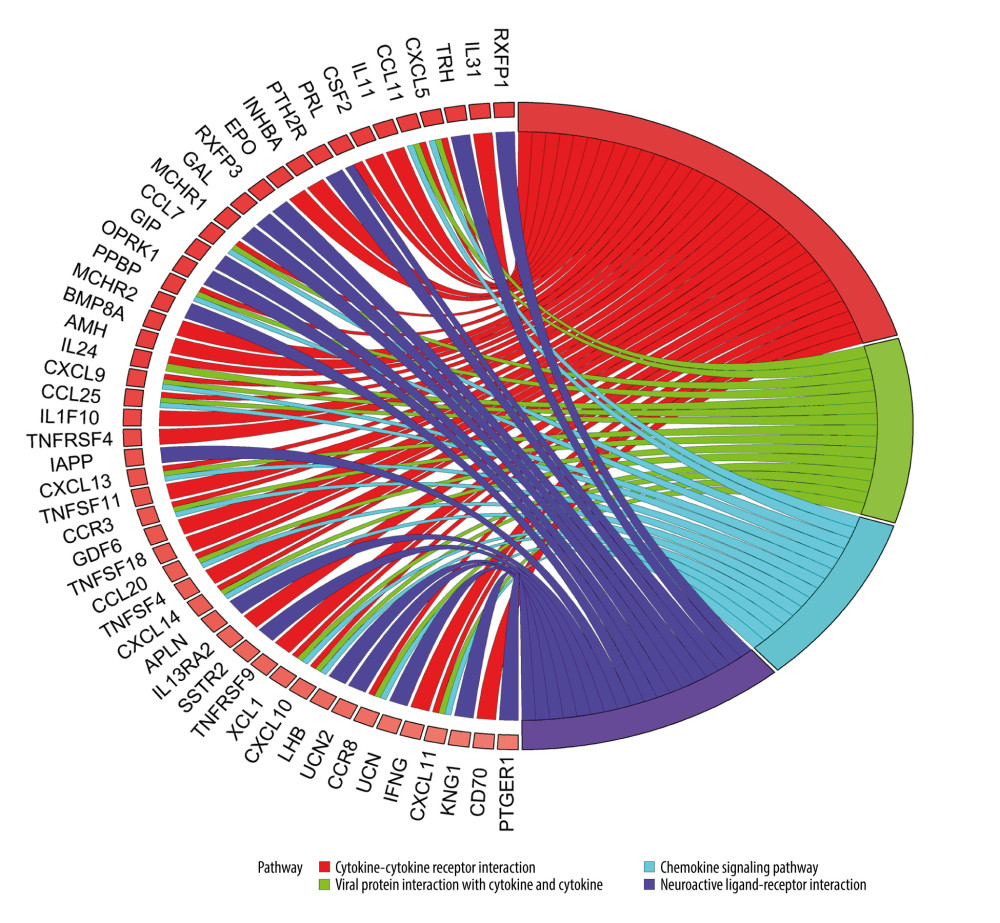 Figure 3. Kyoto Encyclopedia of Genes and Genomes (KEGG) analysis of immune-related upregulated differentially expressed genes. Different color bands correspond to different KEGG enrichment pathways.
 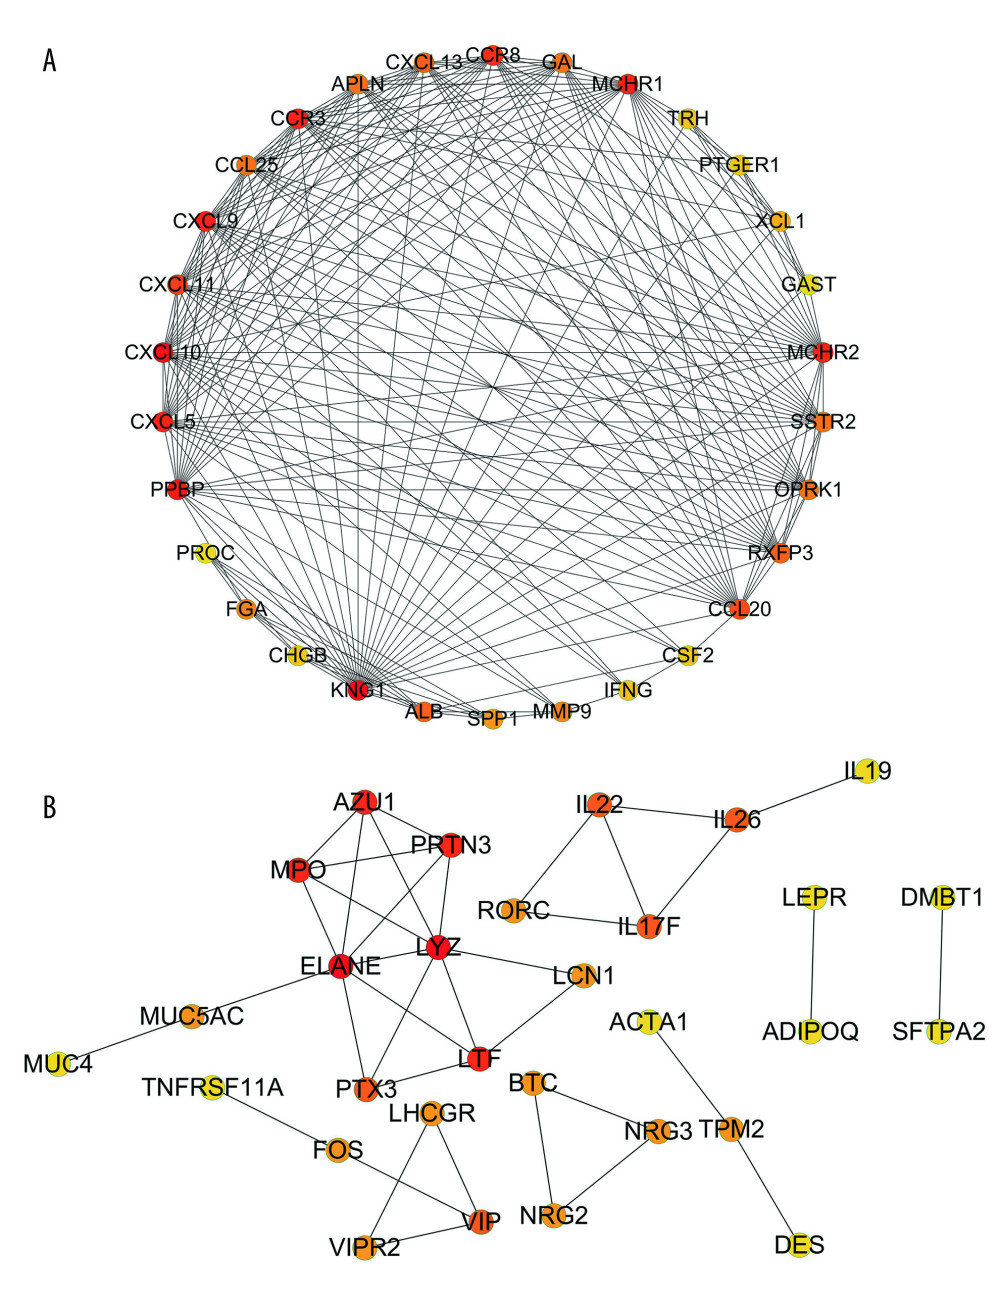 Figure 4. Protein-protein interaction analysis. (A) Immune-related upregulated differentially expressed genes. (B) Immune-related downregulated differentially expressed genes.
 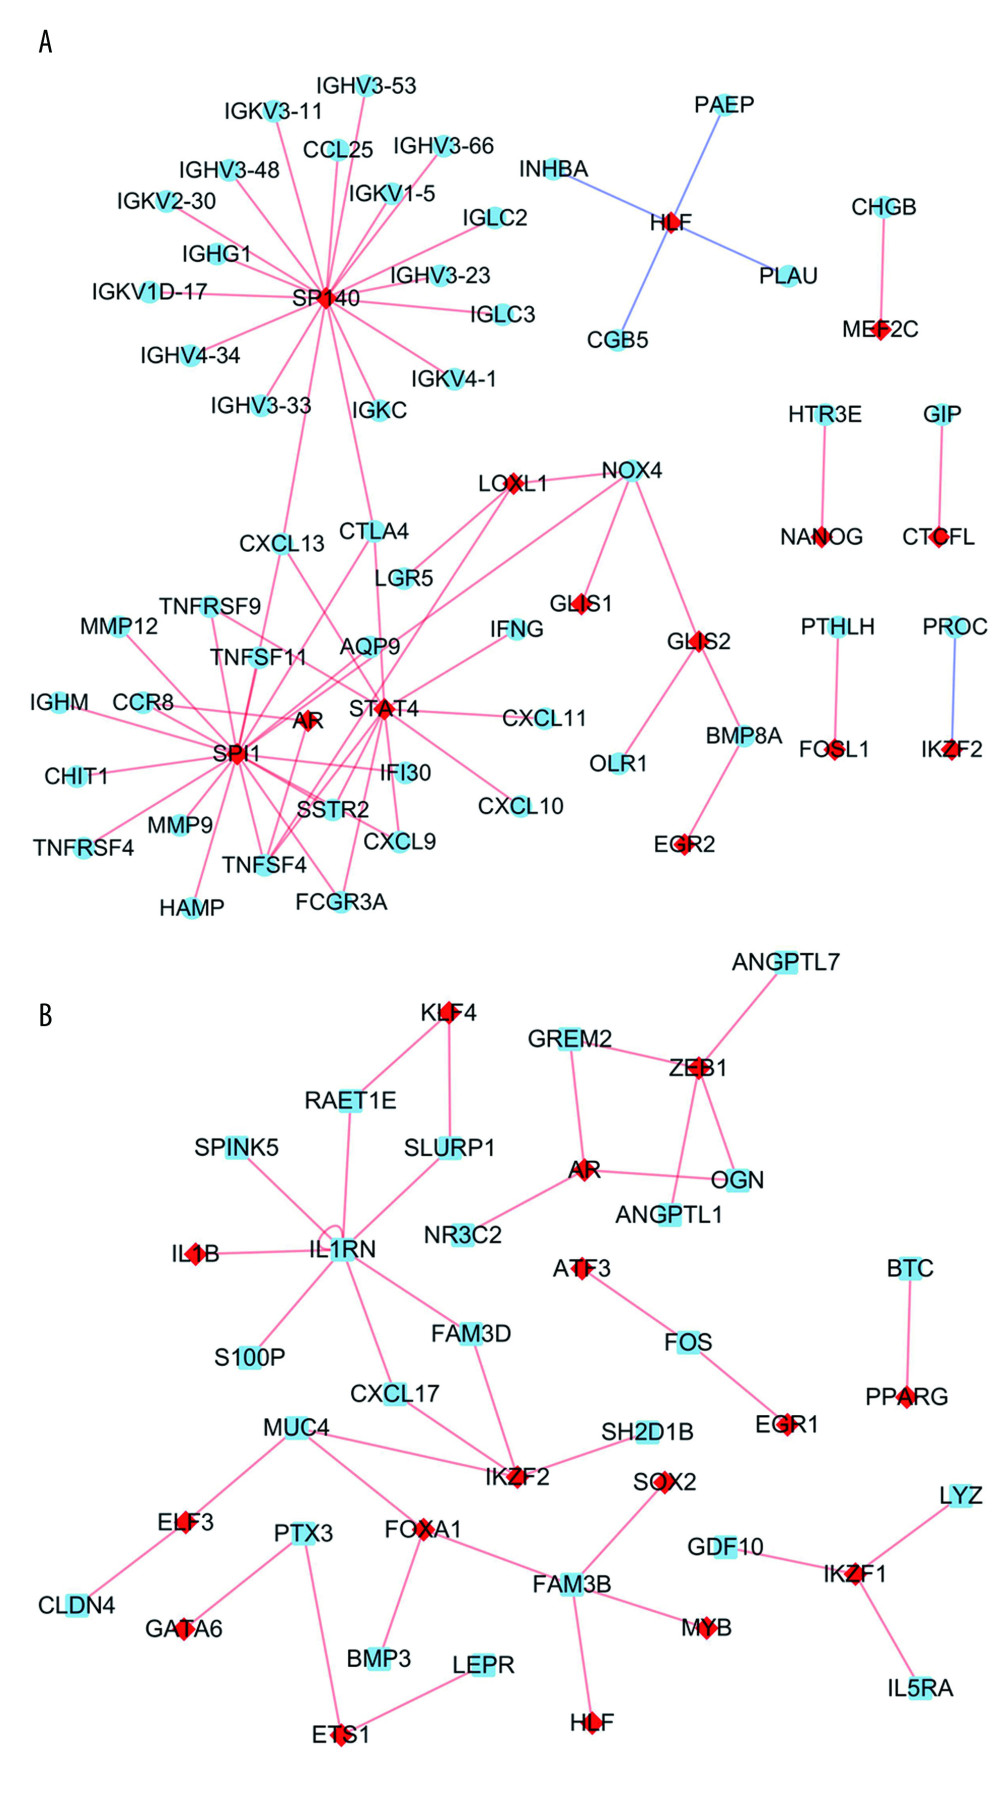 Figure 5. Transcriptional regulator (TR)-mediated regulatory networks. (A) Immune-related upregulated differentially expressed genes. (B) Immune-related downregulated differentially expressed genes. The red and blue nodes represent TRs and immune-related differentially expressed genes, respectively. The red and blue edges represent positive and negative correlation, respectively.
 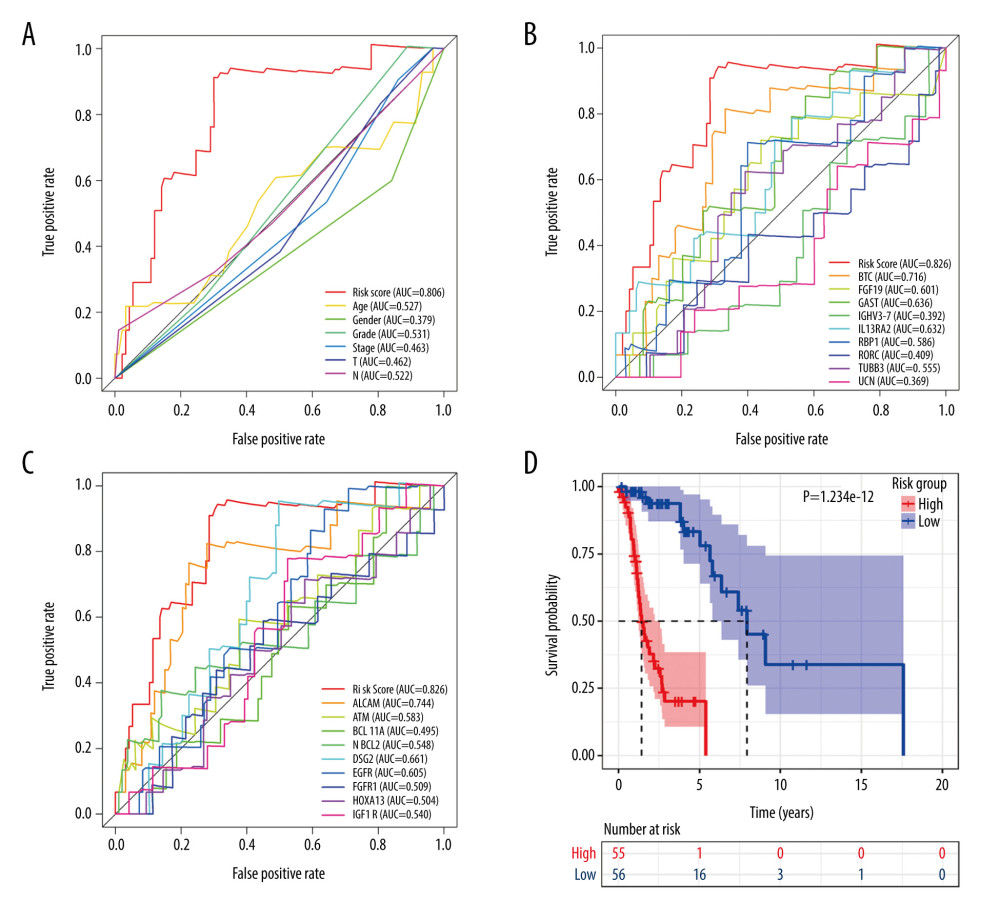 Figure 6. Signature of immune-related differentially expressed genes (IRDEGs). Receiver operating characteristic curves. (A) Risk score and clinical parameters. (B) IRDEGs. (C) Nine prognostic markers. (D) Kaplan-Meier curve of high- and low-risk groups, which were classified based on median risk score of IRDEGs signature.
 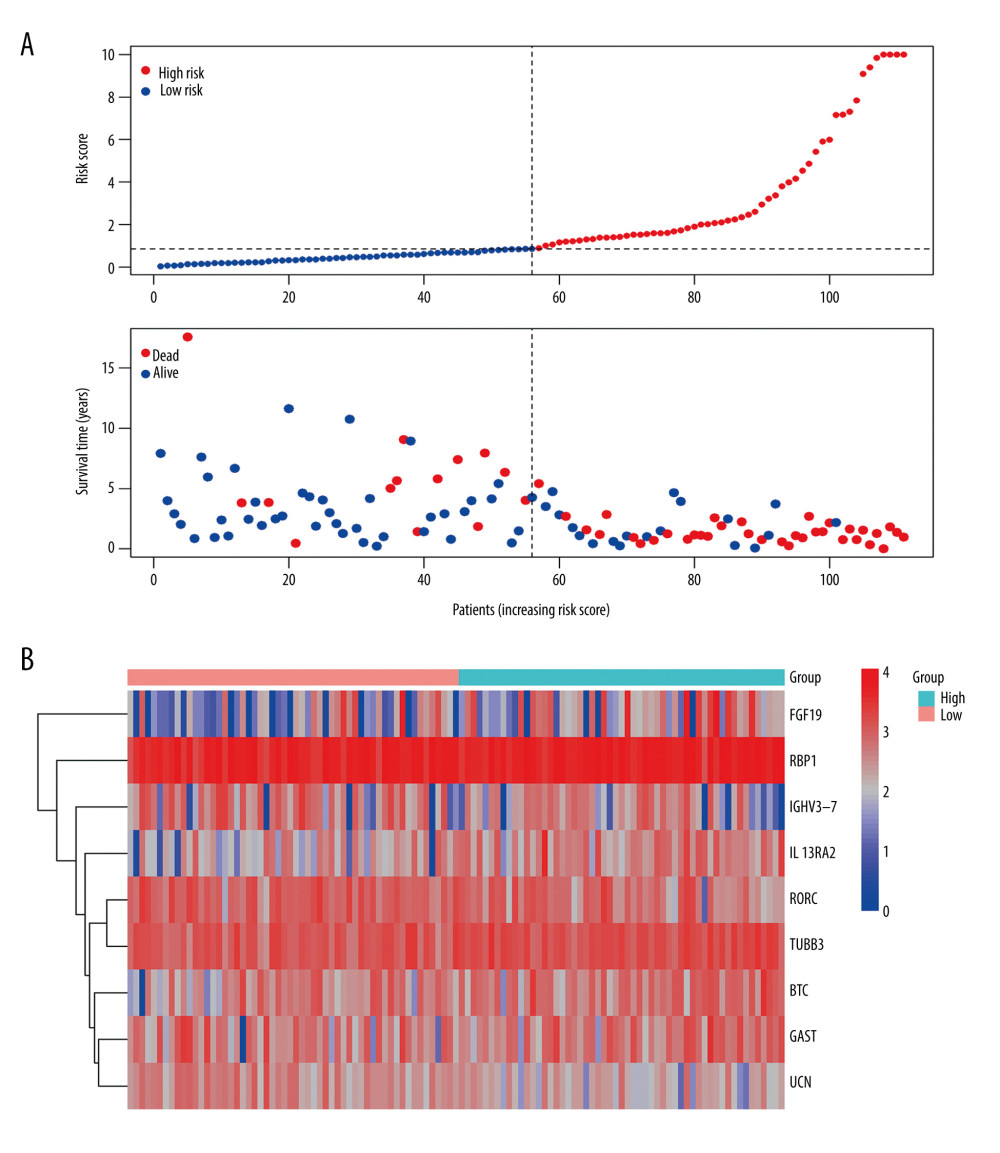 Figure 7. (A) Risk plots for high- and low-risk groups. Each blue dot represents a living patient, whereas each red dot represents a dead patient. (B) Heatmap of expression levels of the 9 genes in response to IRDEGs signature in patients.
 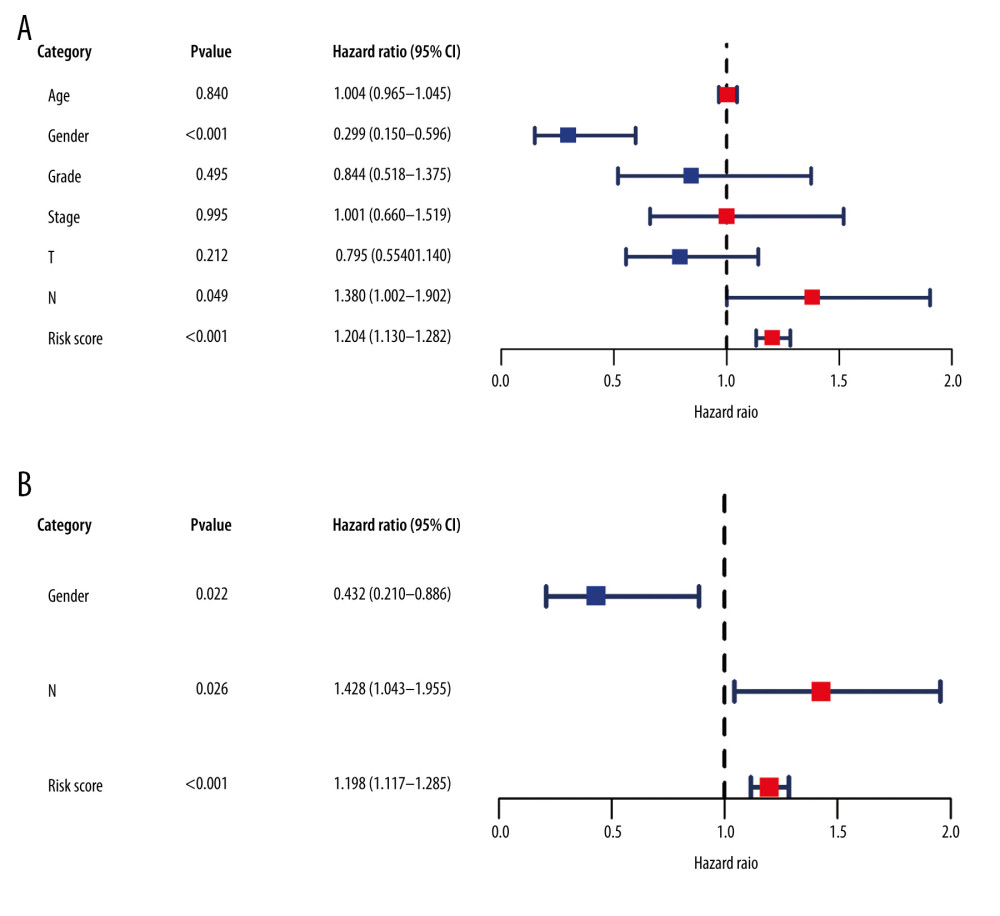 Figure 8. Forest plots reflecting factors related to independent prognosis of laryngeal squamous cell carcinoma. (A) Plot based on univariate Cox regression analysis. (B) Plot based on multivariate Cox regression analysis.
 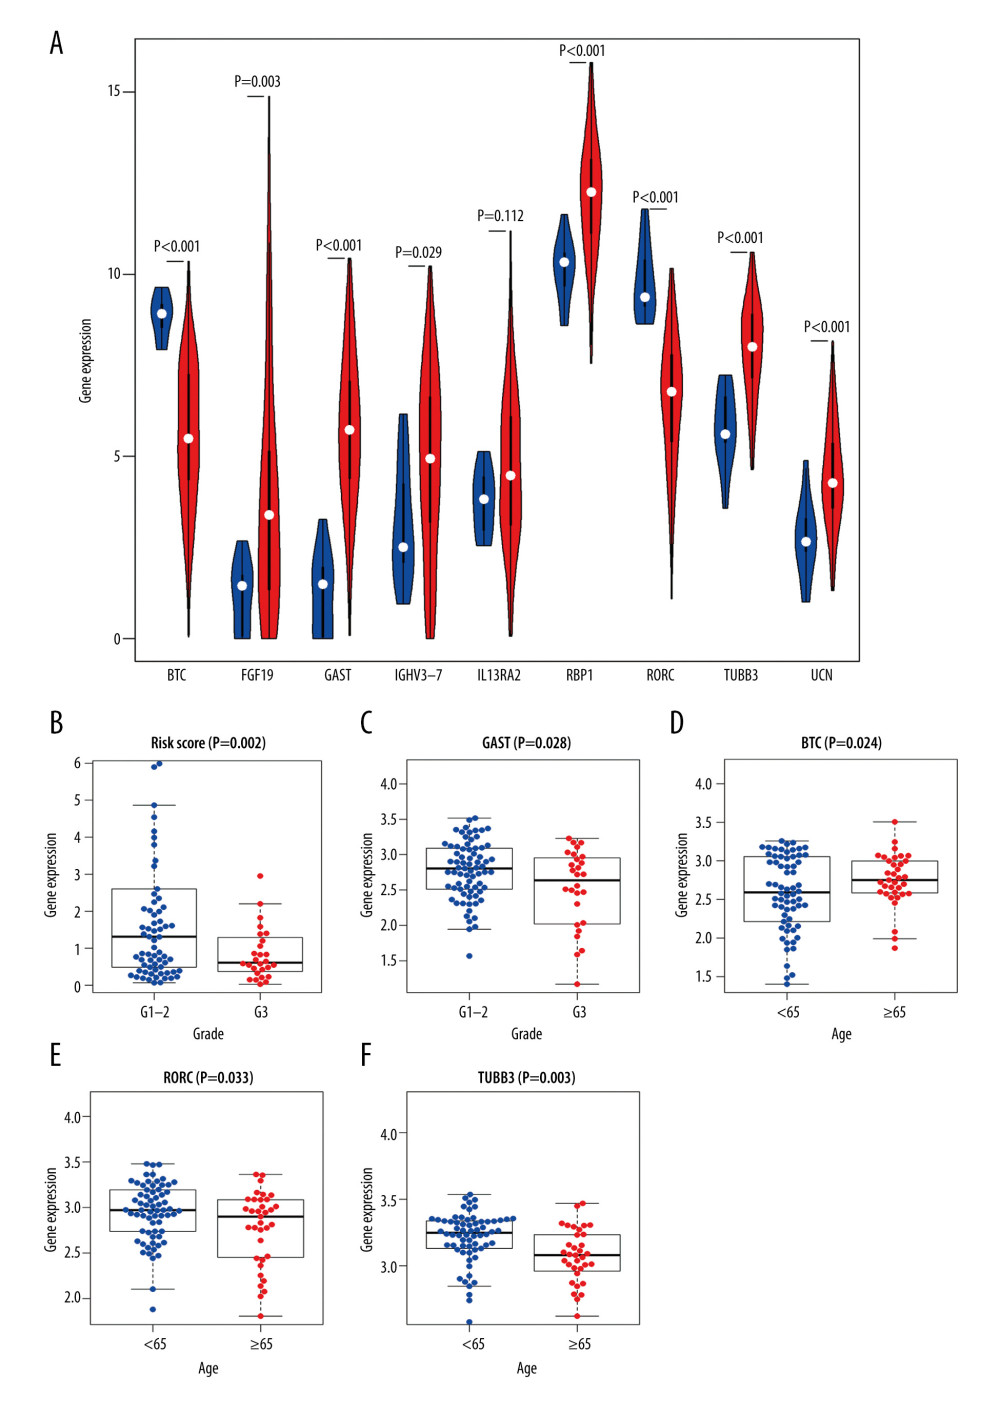 Figure 9. Clinical significance of immune-related differentially expressed genes (IRDEGs) signature in laryngeal squamous cell carcinoma (LSCC). (A) Violin plot showing the difference in expression levels of 9 IRDEGs between LSCC samples (red violin) and control samples (blue violin), based on Wilcoxon test. (B–F) relationship between IRDEGs of signature and clinical parameters. “Grade” means neoplasm histologic grade. Age was in years.
 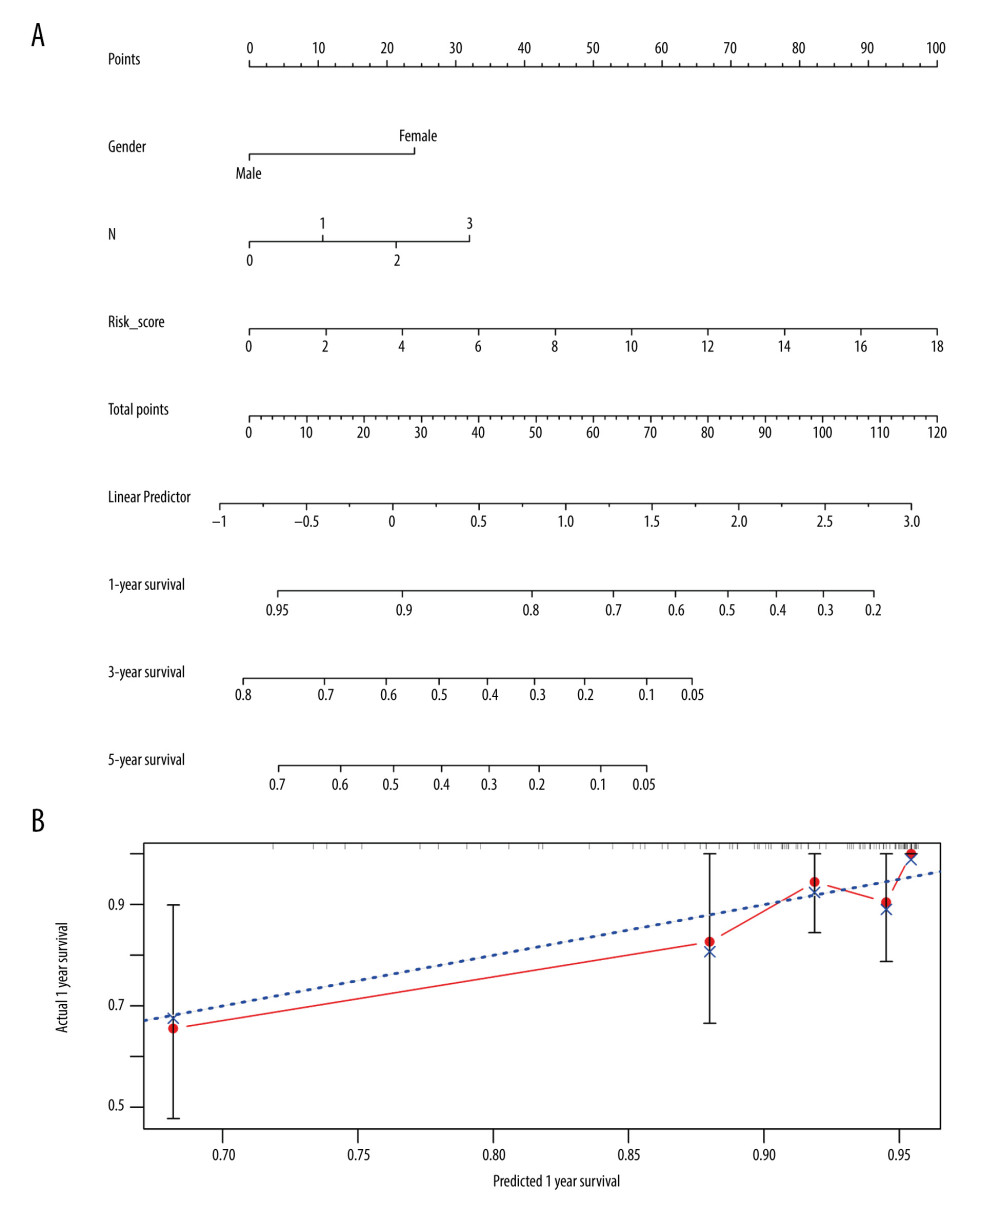 Figure 10. Nomogram and corresponding verification. (A) Nomogram based on immune-related differentially expressed genes and clinical parameters. (B) Calibration curve with a horizontal axis that represents the predicted value of the nomogram and a vertical axis representing the actual survival rate of patients. N, nodes stage.
 Tables
Table 1. Gene Ontology analysis (GO) and Kyoto Encyclopedia of Genes and Genomes (KEGG) analysis for immune-related up-regulated differentially genes and immune-related down-regulated differentially genes.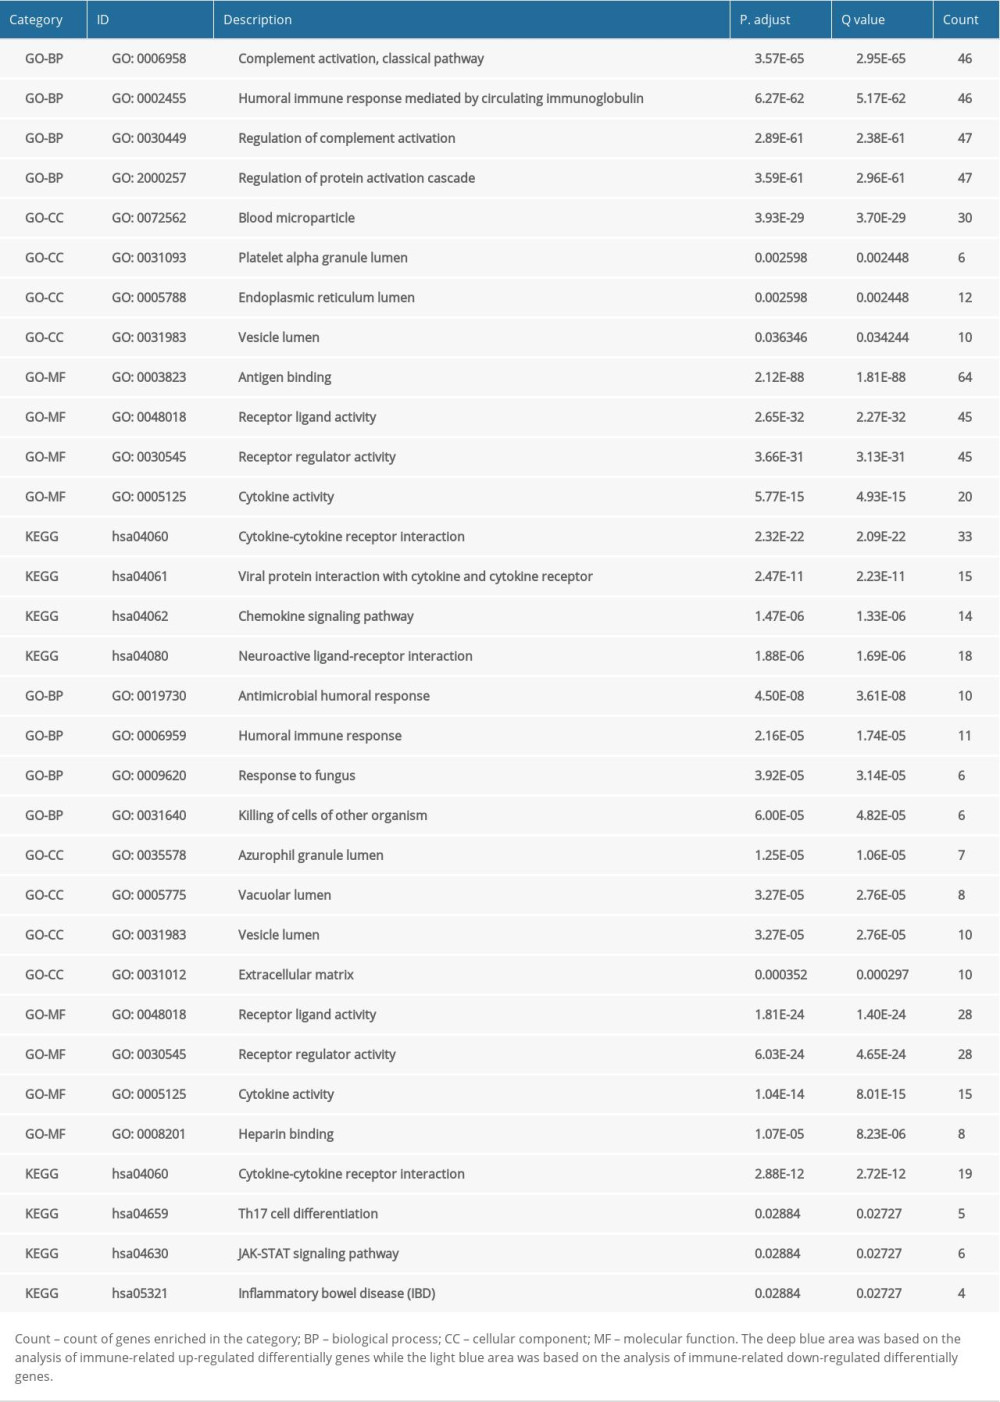 Table 2. Immune-related differentially expressed genes (IRDEGs) included in the signature.
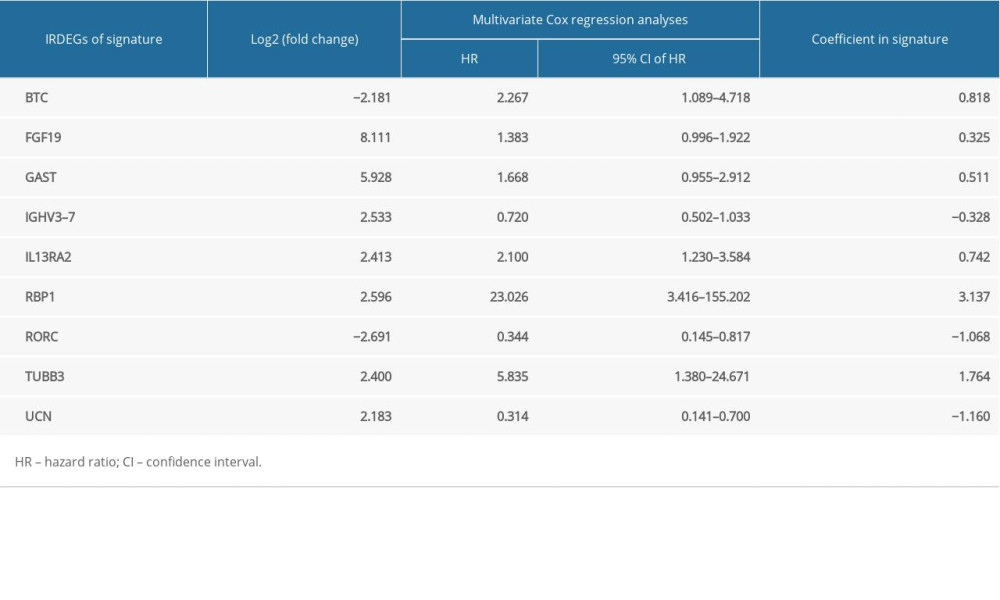 Supplementary Table 1. Clinical information for 102 patients with laryngeal squamous cell carcinoma.
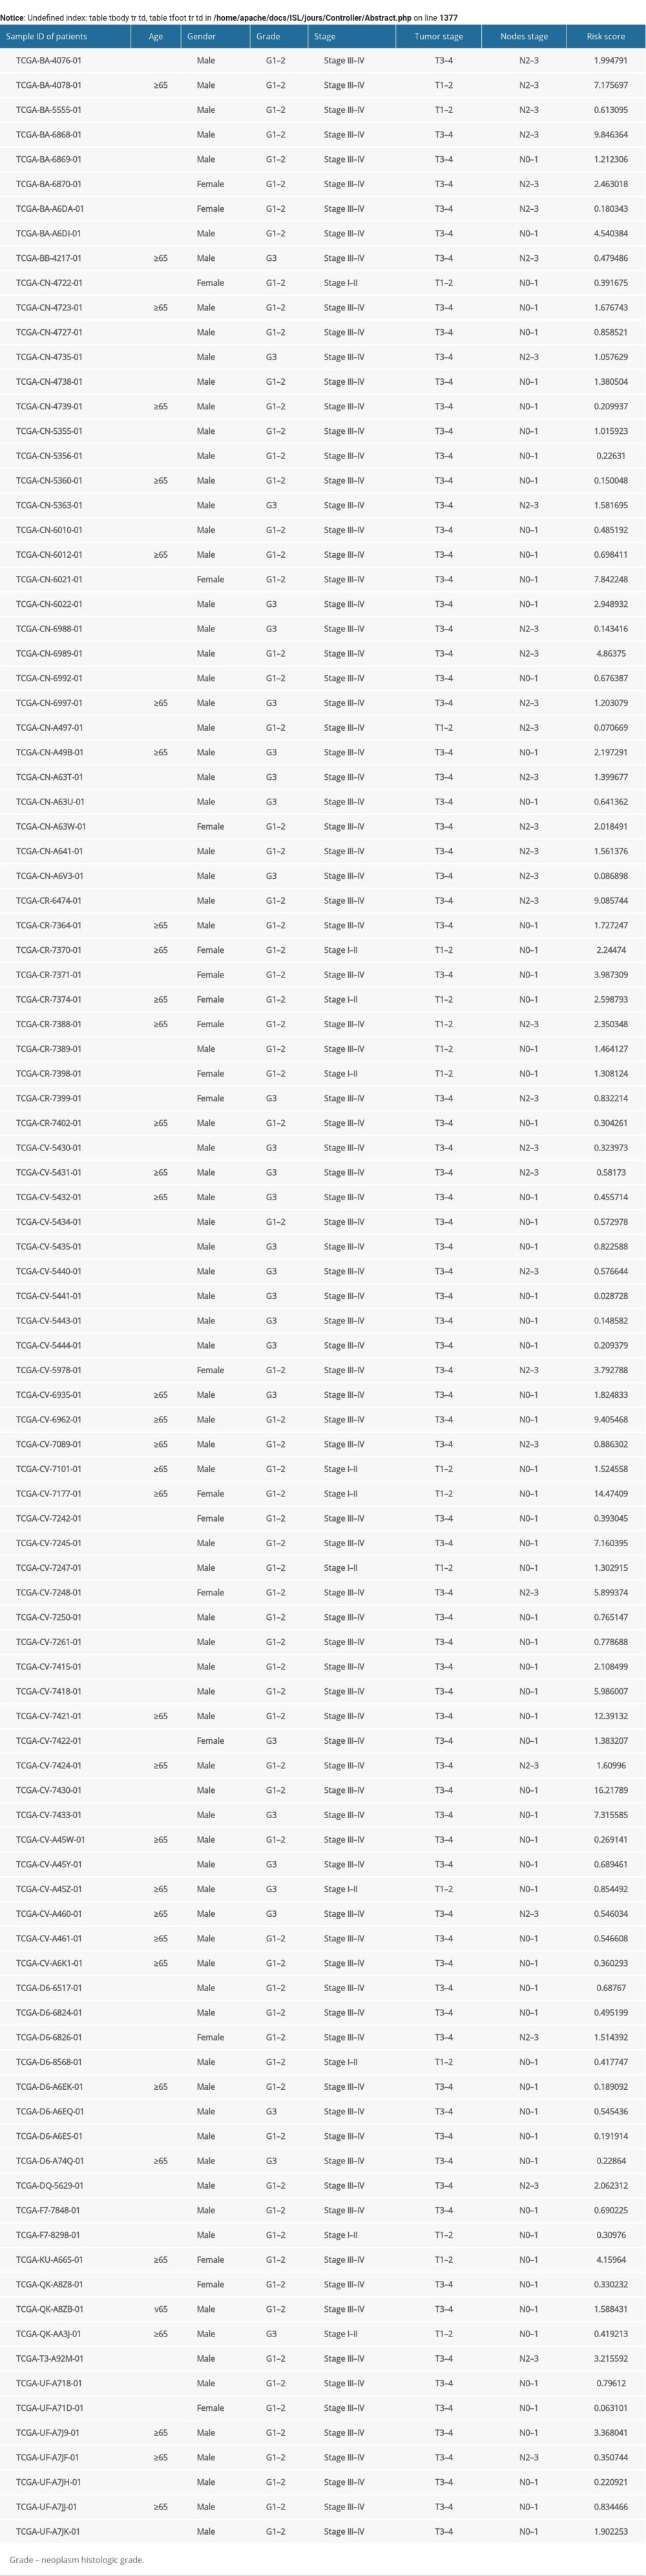
References
1. Gamez ME, Blakaj A, Zoller W, Emerging concepts and novel strategies in radiation therapy for laryngeal cancer management: Cancers (Basel), 2020; 12(6); 1651
2. Elicin O, Giger R, Comparison of current surgical and non-surgical treatment strategies for early and locally advanced stage glottic laryngeal cancer and their outcome: Cancers (Basel), 2020; 12(3); 732
3. Wang H, Qian J, Xia X, Long non-coding RNA OIP5-AS1 serves as an oncogene in laryngeal squamous cell carcinoma by regulating miR-204-5p/ZEB1 axis: Naunyn Schmiedebergs Arch Pharmacol, 2020 [Online ahead of print]
4. Yang T, Li S, Liu J, Long non-coding RNA KRT16P2/miR-1294/EGFR axis regulates laryngeal squamous cell carcinoma cell aggressiveness: Am J Transl Res, 2020; 12(6); 2939-55
5. Guo Y, Huang Q, Zheng J, Diagnostic role of dysregulated circular RNA hsa_circ_0036722 in laryngeal squamous cell carcinoma: Onco Targets Ther, 2020; 13; 5709-19
6. Tang X-Z, Zhou X-G, Zhang X-G, The clinical significance of Interleukin 24 and its potential molecular mechanism in laryngeal squamous cell carcinoma: Cancer Biomark, 2020; 29(1); 111-24
7. Bray F, Ferlay J, Soerjomataram I, Global cancer statistics 2018: GLOBOCAN estimates of incidence and mortality worldwide for 36 cancers in 185 countries: Cancer J Clin, 2018; 68(6); 394-424
8. Dietz A, Wichmann G, Kuhnt T, Induction chemotherapy (IC) followed by radiotherapy (RT) versus cetuximab plus IC and RT in advanced laryngeal/hypopharyngeal cancer resectable only by total laryngectomy-final results of the larynx organ preservation trial DeLOS-II: Ann Oncol, 2018; 29(10); 2105-14
9. Steuer CE, El-Deiry M, Parks JR, An update on larynx cancer: Cancer J Clin, 2017; 67(1); 31-50
10. Pedregal-Mallo D, Sánchez Canteli M, López F, Oncological and functional outcomes of transoral laser surgery for laryngeal carcinoma: Eur Arch Otorhinolaryngol, 2018; 275(8); 2071-77
11. Giotakis AI, Pototschnig C, Use of erbium laser in the treatment of persistent post-radiotherapy laryngeal edema: A case report and review of the literature: World J Surg Oncol, 2018; 16(1); 176
12. Dietz A, Wiegand S, Kuhnt T, Laryngeal preservation approaches: Considerations for new selection criteria based on the DeLOS-II Trial: Front Oncol, 2019; 9; 625
13. Menach OP, Patel A, Oburra HO, Demography and histologic pattern of laryngeal squamous cell carcinoma in kenya: Int J Otolaryngol, 2014; 2014 507189
14. de Bree R, The current indications for non-surgical treatment of hypopharyngeal cancer: Adv Otorhinolaryngol, 2019; 83; 76-89
15. Fulcher CD, Haigentz M, Ow TJ, AHNS Series: Do you know your guidelines? Principles of treatment for locally advanced or unresectable head and neck squamous cell carcinoma: Head Neck, 2018; 40(4); 676-86
16. Mannelli G, Lazio MS, Luparello P, Conservative treatment for advanced T3–T4 laryngeal cancer: Meta-analysis of key oncological outcomes: Eur Arch Otorhinolaryngol, 2018; 275(1); 27-38
17. Nocini R, Molteni G, Mattiuzzi C, Updates on larynx cancer epidemiology: Chin J Cancer Res, 2020; 32(1); 18-25
18. Praud D, Rota M, Rehm J, Cancer incidence and mortality attributable to alcohol consumption: Int J Cancer, 2016; 138(6); 1380-87
19. Ahmad Kiadaliri A, Jarl J, Gavriilidis G, Alcohol drinking cessation and the risk of laryngeal and pharyngeal cancers: A systematic review and meta-analysis: PLoS One, 2013; 8(3); e58158
20. Kawakita D, Matsuo K, Alcohol and head and neck cancer: Cancer Metastasis Rev, 2017; 36(3); 425-34
21. Kang D-M, Kim J-E, Kim Y-K, Occupational burden of asbestos-related diseases in Korea, 1998–2013: Asbestosis, mesothelioma, lung cancer, laryngeal cancer, and ovarian cancer: J Korean Med Sci, 2018; 33(35); e226
22. Yang D, Shi Y, Tang Y, Effect of HPV Infection on the occurrence and development of laryngeal cancer: A review: J Cancer, 2019; 10(19); 4455-62
23. Wang H-T, Tong X, Zhang Z-X, MYCT1 represses apoptosis of laryngeal cancerous cells through the MAX/miR-181a/NPM1 pathway: FEBS J, 2019; 286(19); 3892-908
24. Dogantemur S, Ozdemir S, Uguz A, Assessment of HPV 16, HPV 18, p16 expression in advanced stage laryngeal cancer patients and prognostic significance: Braz J Otorhinolaryngol, 2020; 86(3); 351-57
25. Shen N, Duan XH, Wang XL, Effect of NLK on the proliferation and invasion of laryngeal carcinoma cells by regulating CDCP1: Eur Rev Med Pharmacol Sci, 2019; 23(14); 6226-33
26. Tang X, Sun Y, Wan G, Knockdown of YAP inhibits growth in Hep-2 laryngeal cancer cells via epithelial-mesenchymal transition and the Wnt/β-catenin pathway: BMC Cancer, 2019; 19(1); 654
27. Yang J, Zhou L, Zhang Y, DIAPH1 is upregulated and inhibits cell apoptosis through ATR/p53/Caspase-3 signaling pathway in laryngeal squamous cell carcinoma: Dis Markers, 2019; 2019 6716472
28. Zhu X, Zhu R, Curcumin suppresses the progression of laryngeal squamous cell carcinoma through the upregulation of miR-145 and inhibition of the PI3K/Akt/mTOR pathway: Onco Targets Ther, 2018; 11; 3521-31
29. Zhao X, Xu F, Dominguez NP, FGFR4 provides the conduit to facilitate FGF19 signaling in breast cancer progression: Mol Carcinog, 2018; 57(11); 1616-25
30. Gong L, Mao W, Chen Q, Analysis of SPARC and TUBB3 as predictors for prognosis in esophageal squamous cell carcinoma receiving nab-paclitaxel plus cisplatin neoadjuvant chemotherapy: A prospective study: Cancer Chemother Pharmacol, 2019; 83(4); 639-47
31. Erhart F, Hackl M, Hahne H, Combined proteomics/miRNomics of dendritic cell immunotherapy-treated glioblastoma patients as a screening for survival-associated factors: NPJ Vaccines, 2020; 5; 5
32. Birtalan E, Danos K, Gurbi B, Expression of PD-L1 on Immune cells shows better prognosis in laryngeal, oropharygeal, and hypopharyngeal cancer: Appl Immunohistochem Mol Morphol, 2018; 26(7); e79-85
33. Zhang C, Guan Z, Peng JThe correlation between stanniocalcin 2 expression and prognosis in laryngeal squamous cell cancer: Lin Chung Er Bi Yan Hou Tou Jing Wai Ke Za Zhi, 2015; 29(2); 102-7 [in Chinese]
34. Robinson MD, McCarthy DJ, Smyth GK, edgeR: A Bioconductor package for differential expression analysis of digital gene expression data: Bioinformatics, 2010; 26(1); 139-40
35. Yu G, Wang L-G, Han Y, clusterProfiler: An R package for comparing biological themes among gene clusters: OMICS, 2012; 16(5); 284-87
36. Qin Q, Fan J, Zheng R, Lisa: Inferring transcriptional regulators through integrative modeling of public chromatin accessibility and ChIP-seq data: Genome Biol, 2020; 21(1); 32
37. Engebretsen S, Bohlin J, Statistical predictions with glmnet: Clin Epigenetics, 2019; 11(1); 123
38. Heagerty PJ, Zheng Y, Survival model predictive accuracy and ROC curves: Biometrics, 2005; 61(1); 92-105
39. Nicolau-Neto P, de Souza-Santos PT, Severo Ramundo M, Transcriptome analysis identifies ALCAM overexpression as a prognosis biomarker in laryngeal squamous cell carcinoma: Cancers (Basel), 2020; 12(2); 470
40. Bruine de Bruin L, Schuuring E, de Bock GH, High pATM is associated with poor local control in supraglottic cancer treated with radiotherapy: Laryngoscope, 2020; 130(8); 1954-60
41. Zhou J, Zhou L, Zhang D, BCL11A promotes the progression of laryngeal squamous cell carcinoma: Front Oncol, 2020; 10; 375
42. Lovato A, Franz L, Carraro V, Maspin expression and anti-apoptotic pathway regulation by bcl2 in laryngeal cancer: Ann Diagn Pathol, 2020; 45; 151471
43. Cury SS, Lapa RML, de Mello JBH, Increased DSG2 plasmatic levels identified by transcriptomic-based secretome analysis is a potential prognostic biomarker in laryngeal carcinoma: Oral Oncol, 2020; 103; 104592
44. Leesutipornchai T, Ratchataswan T, Vivatvakin S, EGFR cut-off point for prognostic impact in laryngeal squamous cell carcinoma: Acta Otolaryngol, 2020; 140(7); 610-14
45. Klobučar M, Visentin S, Jakovčević A, Expression of polysialic acid in primary laryngeal squamous cell carcinoma: Life Sci, 2017; 173; 73-79
46. Li J, Ye M, Zhou C, Expression profile and prognostic values of family members in laryngeal squamous cell cancer: Front Oncol, 2020; 10; 368
47. Ben Elhadj M, Goucha A, Fourati A, The prognostic significance of IGF-1R and the predictive risk value of circulating IGF-1 in Tunisian patients with laryngeal carcinoma: Cancer Invest, 2020; 38(5); 289-99
48. Szczerba BM, Castro-Giner F, Vetter M, Neutrophils escort circulating tumour cells to enable cell cycle progression: Nature, 2019; 566(7745); 553-57
49. Macor P, Capolla S, Tedesco F, Complement as a biological tool to control tumor growth: Front Immunol, 2018; 9; 2203
50. Xu J, Fang J, Cheng Z, Overexpression of the Kininogen-1 inhibits proliferation and induces apoptosis of glioma cells: J Exp Clin Cancer Res, 2018; 37(1); 180
51. Karin N, Chemokines and cancer: New immune checkpoints for cancer therapy: Curr Opin Immunol, 2018; 51; 140-45
52. Sarvestani SK, Signs SA, Lefebvre V, Cancer-predicting transcriptomic and epigenetic signatures revealed for ulcerative colitis in patient-derived epithelial organoids: Oncotarget, 2018; 9(47); 28717-30
53. Wei Z, Wu B, Wang L, A large-scale transcriptome analysis identified ELANE and PRTN3 as novel methylation prognostic signatures for clear cell renal cell carcinoma: J Cell Physiol, 2020; 235(3); 2582-89
54. Luo D, Ge W, MeCP2 promotes colorectal cancer metastasis by modulating ZEB1 transcription: Cancers (Basel), 2020; 12(3); 758
55. Zhou Y, Zhong J-H, Gong F-S, MiR-141-3p suppresses gastric cancer induced transition of normal fibroblast and BMSC to cancer-associated fibroblasts via targeting STAT4: Exp Mol Pathol, 2019; 107; 85-94
56. Gao J, Ulekleiv CH, Halstensen TS, Epidermal growth factor (EGF) receptor-ligand based molecular staging predicts prognosis in head and neck squamous cell carcinoma partly due to deregulated EGF-induced amphiregulin expression: J Exp Clin Cancer Res, 2016; 35(1); 151
57. Gao L, Lang L, Zhao X, FGF19 amplification reveals an oncogenic dependency upon autocrine FGF19/FGFR4 signaling in head and neck squamous cell carcinoma: Oncogene, 2019; 38(13); 2394-404
58. Shi S, Zhang Q, Xia Y, Mesenchymal stem cell-derived exosomes facilitate nasopharyngeal carcinoma progression: Am J Cancer Res, 2016; 6(2); 459-72
59. Speck O, Tang W, Morgan DR, Three molecular subtypes of gastric adenocarcinoma have distinct histochemical features reflecting Epstein-Barr virus infection status and neuroendocrine differentiation: Appl Immunohistochem Mol Morphol, 2015; 23(9); 633-45
60. Cao D, Qi Z, Pang Y, Retinoic acid-related orphan receptor c regulates proliferation, glycolysis, and chemoresistance via the PD-L1/ITGB6/STAT3 signaling axis in bladder cancer: Cancer Res, 2019; 79(10); 2604-18
61. Zhu C, Sun Z, Li C, Urocortin affects migration of hepatic cancer cell lines via differential regulation of cPLA2 and iPLA2: Cell Signal, 2014; 26(5); 1125-34
62. Koh Y, Kim TM, Jeon YK, Class III beta-tubulin, but not ERCC1, is a strong predictive and prognostic marker in locally advanced head and neck squamous cell carcinoma: Ann Oncol, 2009; 20(8); 1414-19
Figures
Figure 1. The main processes of this study. DEGs – differentially expressed genes; IRDEGs – immune-related differentially expressed genes; GO – Gene Ontology; KEGG – Kyoto Encyclopedia of Genes and Genomes; PPI – protein–protein interaction; TR – transcriptional regulator; C-index – concordance index.Figure 2. Gene Ontology (GO) analysis for immune-related upregulated differentially expressed genes. (A) Biological process. (B) Cellular component. (C) Molecular function. The blue nodes in the concentric circles represent genes clustered in specific GO terms. The larger size and darker color of the internal departments represent more significant enrichment of GO terms.Figure 3. Kyoto Encyclopedia of Genes and Genomes (KEGG) analysis of immune-related upregulated differentially expressed genes. Different color bands correspond to different KEGG enrichment pathways.Figure 4. Protein-protein interaction analysis. (A) Immune-related upregulated differentially expressed genes. (B) Immune-related downregulated differentially expressed genes.Figure 5. Transcriptional regulator (TR)-mediated regulatory networks. (A) Immune-related upregulated differentially expressed genes. (B) Immune-related downregulated differentially expressed genes. The red and blue nodes represent TRs and immune-related differentially expressed genes, respectively. The red and blue edges represent positive and negative correlation, respectively.Figure 6. Signature of immune-related differentially expressed genes (IRDEGs). Receiver operating characteristic curves. (A) Risk score and clinical parameters. (B) IRDEGs. (C) Nine prognostic markers. (D) Kaplan-Meier curve of high- and low-risk groups, which were classified based on median risk score of IRDEGs signature.Figure 7. (A) Risk plots for high- and low-risk groups. Each blue dot represents a living patient, whereas each red dot represents a dead patient. (B) Heatmap of expression levels of the 9 genes in response to IRDEGs signature in patients.Figure 8. Forest plots reflecting factors related to independent prognosis of laryngeal squamous cell carcinoma. (A) Plot based on univariate Cox regression analysis. (B) Plot based on multivariate Cox regression analysis.Figure 9. Clinical significance of immune-related differentially expressed genes (IRDEGs) signature in laryngeal squamous cell carcinoma (LSCC). (A) Violin plot showing the difference in expression levels of 9 IRDEGs between LSCC samples (red violin) and control samples (blue violin), based on Wilcoxon test. (B–F) relationship between IRDEGs of signature and clinical parameters. “Grade” means neoplasm histologic grade. Age was in years.Figure 10. Nomogram and corresponding verification. (A) Nomogram based on immune-related differentially expressed genes and clinical parameters. (B) Calibration curve with a horizontal axis that represents the predicted value of the nomogram and a vertical axis representing the actual survival rate of patients. N, nodes stage. Tables
Table 1. Gene Ontology analysis (GO) and Kyoto Encyclopedia of Genes and Genomes (KEGG) analysis for immune-related up-regulated differentially genes and immune-related down-regulated differentially genes.Table 2. Immune-related differentially expressed genes (IRDEGs) included in the signature.Table 1. Gene Ontology analysis (GO) and Kyoto Encyclopedia of Genes and Genomes (KEGG) analysis for immune-related up-regulated differentially genes and immune-related down-regulated differentially genes.Table 2. Immune-related differentially expressed genes (IRDEGs) included in the signature.Supplementary Table 1. Clinical information for 102 patients with laryngeal squamous cell carcinoma. In Press
06 Mar 2024 : Clinical Research
Comparison of Outcomes between Single-Level and Double-Level Corpectomy in Thoracolumbar Reconstruction: A ...Med Sci Monit In Press; DOI: 10.12659/MSM.943797
21 Mar 2024 : Meta-Analysis
Economic Evaluation of COVID-19 Screening Tests and Surveillance Strategies in Low-Income, Middle-Income, a...Med Sci Monit In Press; DOI: 10.12659/MSM.943863
10 Apr 2024 : Clinical Research
Predicting Acute Cardiovascular Complications in COVID-19: Insights from a Specialized Cardiac Referral Dep...Med Sci Monit In Press; DOI: 10.12659/MSM.942612
06 Mar 2024 : Clinical Research
Enhanced Surgical Outcomes of Popliteal Cyst Excision: A Retrospective Study Comparing Arthroscopic Debride...Med Sci Monit In Press; DOI: 10.12659/MSM.941102
Most Viewed Current Articles
17 Jan 2024 : Review article
Vaccination Guidelines for Pregnant Women: Addressing COVID-19 and the Omicron VariantDOI :10.12659/MSM.942799
Med Sci Monit 2024; 30:e942799
14 Dec 2022 : Clinical Research
Prevalence and Variability of Allergen-Specific Immunoglobulin E in Patients with Elevated Tryptase LevelsDOI :10.12659/MSM.937990
Med Sci Monit 2022; 28:e937990
16 May 2023 : Clinical Research
Electrophysiological Testing for an Auditory Processing Disorder and Reading Performance in 54 School Stude...DOI :10.12659/MSM.940387
Med Sci Monit 2023; 29:e940387
01 Jan 2022 : Editorial
Editorial: Current Status of Oral Antiviral Drug Treatments for SARS-CoV-2 Infection in Non-Hospitalized Pa...DOI :10.12659/MSM.935952
Med Sci Monit 2022; 28:e935952