17 August 2020: Animal Study
Omipalisib Inhibits Esophageal Squamous Cell Carcinoma Growth Through Inactivation of Phosphoinositide 3-Kinase (PI3K)/AKT/Mammalian Target of Rapamycin (mTOR) and ERK Signaling
Dong-shan Zhu1ABCDEF, Jing-yao Dong1BCF, Yao-yao Xu2BCD, Xin-tong Zhang2BCD, Shi-bo Fu2ACEFG, Wei Liu1ACEFG*DOI: 10.12659/MSM.927106
Med Sci Monit 2020; 26:e927106


Abstract
BACKGROUND: Esophageal squamous cell carcinoma (ESCC) is a life-threatening digestive tract malignancy with no known curative treatment. This study aimed to investigate the antineoplastic effects of omipalisib and its underlying molecular mechanisms in ESCC using a high throughput screen.
MATERIAL AND METHODS: MTT assay and clone formation were used to determine cell viability and proliferation. Flow cytometry was conducted to detect cell cycle distribution and apoptosis. Global gene expression and mRNA expression levels were determined by RNA sequencing and real-time PCR, respectively. Protein expression was evaluated in the 4 ESCC cell lines by Western blot analysis. Finally, a xenograft nude mouse model was used to evaluate the effect of omipalisib on tumor growth in vivo.
RESULTS: In the pilot screening of a 1404-compound library, we demonstrated that omipalisib markedly inhibited cell proliferation in a panel of ESCC cell lines. Mechanistically, omipalisib induced G₀/G₁ cell cycle arrest and apoptosis. RNA-seq, KEGG, and GSEA analyses revealed that the PI3K/AKT/mTOR pathway is the prominent target of omipalisib in ESCC cells. Treatment with omipalisib decreased expression of p-AKT, p-4EBP1, p-p70S6K, p-S6, and p-ERK, therefore disrupting the activation of PI3K/AKT/mTOR and ERK signaling. In the nude mouse xenograft model, omipalisib significantly suppressed the tumor growth in ESCC tumor-bearing mice without obvious adverse effects.
CONCLUSIONS: Omipalisib inhibited the proliferation and growth of ESCC by disrupting PI3K/AKT/mTOR and ERK signaling. The present study supports the rationale for using omipalisib as a therapeutic approach in ESCC patients. Further clinical studies are needed.
Keywords: Apoptosis Regulatory Proteins, Cell Cycle Checkpoints, Esophageal Neoplasms, Phosphatidylinositol 3-Kinases, TOR Serine-Threonine Kinases, esophageal squamous cell carcinoma, Proto-Oncogene Proteins c-akt, Pyridazines, Quinolines, Sulfonamides
Background
Esophageal cancer is a major global health issue. In 2018, there were 572 000 new cases of esophageal cancer and 209 000 related deaths worldwide [1]. Esophageal squamous cell carcinoma (ESCC) and esophageal adenocarcinoma are the 2 main histological subtypes of esophageal cancer. A phenotypic shift has occurred in esophageal adenocarcinoma in recent decades, but ESCC remains dominant globally [2]. The standard therapy for esophageal cancer is surgery with adjuvant chemotherapy or radiotherapy. Although some improvements have been made in surgical methods and chemotherapy in recent years, the overall 5-year survival rate for esophageal cancer patients has remained only 15–25% [3]. Because of the poor prognosis of esophageal cancer, new therapeutic strategies are urgently needed.
Over the past decade, there has been unprecedented development of targeted and immunotherapies for ESCC; however, the successful clinical application of these therapies is a long way off. Drug repurposing – the identification of new therapeutic indications for approved drugs – is a reasonable way to accelerate “new” drug discovery and development [4,5]. For example, metformin is an oral drug for type 2 diabetes, which decreases gluconeogenesis and intestinal glucose absorption and enhances insulin sensitivity. Mounting evidence suggests that metformin exerts a suppressive effect on multiple types of tumors by suppressing oxidative phosphorylation and the phosphoinositide 3-kinase (PI3K)/AKT/mammalian target of rapamycin (mTOR) pathways. Clinical trials combining metformin with chemotherapy, tyrosine kinase inhibitors, and radiotherapy are underway [6].
To seek potential drugs for use in ESCC, we screened 1404 FDA-approved compounds from a compound library for bioactivity against ESCC. After excluding chemotherapeutic drugs, we identified 13 compounds that inhibited proliferation in a panel of ESCC cell lines. From the 13 compounds, we focused on omipalisib, a highly selective and potent inhibitor of the PI3K/AKT/mTOR signaling pathway. The PI3K/AKT/mTOR pathway is involved in cell proliferation, survival, and metabolism and has been identified as a potential target for the treatment of multiple types of cancers [7–10]. A previous study demonstrated that the activation of genes in the PI3K pathway was found in 24% of ESCC patients worldwide [11]. Furthermore, mTOR signaling activation was identified as an independent risk factor significantly associated with poor prognosis in ESCC patients [12].
Omipalisib is a selective and reversible ATP-competitive inhibitor with subnanomolar activity against p110α, p110β, p110γ, p110σ, and the mTOR1 and mTOR2 complexes [13]. Preclinical studies demonstrated that omipalisib suppresses the phosphorylation of AKT, S6, and 4EBP1, exerting antineoplastic activity
In the current study, we demonstrated the capacity of omipalisib against ESCC and its molecular mechanism
Material and Methods
REAGENTS:
The 1404-compound library and cisplatin were purchased from Selleck Chemicals (Shanghai, China) and formulated to a concentration of 10 mM in dimethyl sulfoxide (DMSO). For the animal studies, omipalisib was dissolved in DMSO at 50 mg/mL as a stock solution and further diluted with sterile saline solution.
CELL LINES AND CELL CULTURE:
Human ESCC cell lines KYSE150, KYSE70, KYSE180, and KYSE520 were obtained from CoBioer Biosciences Co, Ltd, (Nanjing, China) and authenticated by a third-party short tandem repeat analysis (Genetic Testing Biotechnology, Suzhou, China). All cell lines were grown in RPMI 1640 medium supplemented with 10% fetal bovine serum and 1% penicillin/streptomycin and incubated at 37 °C in a humidified atmosphere of 5% CO2.
3-(4,5-DIMETHYLTHIAZOL-2-YL)-2,5-DIPHENYLTETRAZOLIUM BROMIDE ASSAY:
The next day, cells were seeded into 96-well plates and treated with various concentrations of compounds (1 μM for compound screening) or vehicle (DMSO). After 72 hours of incubation, 10 μl of 3-(4,5-dimethylthiazol-2-yl)-2,5-diphenyltetrazolium bromide (MTT) solution (5 mg/mL) was added to each well and incubated for 4 hours. Next, the supernatant was removed and 100 μl DMSO was added to dissolve the crystals. The absorbance was recorded at 570 nm and 630 nm with a spectrophotometer (Thermo Fisher Scientific, Vantaa, Finland). The assays were performed in triplicate, and the EC50 of omipalisib for each cell line was calculated by Prism software.
CLONE FORMATION ASSAY:
A clone formation assay was performed as previously described [17]. Briefly, cells were cultured overnight in 12-well plates, and vehicle (DMSO) and a series of concentrations of omipalisib were added to the cells. After 72 hours of incubation, the drug was replaced with fresh medium and cultured for an additional 5 to 10 days. Next, the cells were fixed with methanol for 15 minutes at room temperature and were then stained with Giemsa solution for 15 minutes at room temperature. The colonies containing more than 50 cells were counted manually.
FLOW CYTOMETRY:
For apoptosis analysis, cells were treated with 160 nM omipalisib or vehicle (DMSO) for 72 hours, washed with PBS and binding buffer, and stained with Annexin V (BD Pharmingen) at room temperature in the dark for 15 minutes. Then, the cells were counterstained with propidium iodide (PI) and analyzed immediately by flow cytometry (BD LSRFortessa Cell Analyzer, San Diego, CA, USA). The data were analyzed using FlowJo software.
For cell cycle analysis, cells were treated with various doses of omipalisib (20, 40, 80, and 160 nM) or vehicle (DMSO) for 24 hours. Then, the cells were harvested by trypsinization, followed by fixation with cold 75% ethanol at −20°C overnight. The fixed cells were washed with PBS and incubated with 50 μg4L PI and 100 μg/mL RNAse for 30 minutes at room temperature. The cells were run through a flow cytometer, and the data were analyzed using ModFit LT software.
RNA SEQUENCING AND BIOINFORMATICS ANALYSIS:
KYSE150 cells were seeded in 6-cm dishes at 8.5×10⁵/dish. The next day, vehicle or 1 μM omipalisib was added to the cells and incubated for 8 hours. Then, the cells were harvested by trypsinization and sent to BGI Genomics (Shenzhen, China) on dry ice for RNA sequencing (RNA-seq) analysis. After sequencing, the raw data were filtered via quality control into clean reads, and these were subjected to alignment with the reference sequences (GCF_000001405.38_GRCh38.p12, Homo sapiens, NCBI) using hierarchical indexing for spliced alignment of transcripts software. The gene expression levels were calculated using the FPKM method. The DEGseq method was used to obtain differentially expressed genes (DEGs) [18]. The criteria for screening DEGs were as follows: fold change ≥2 and adjusted P value ≤0.001. The enrichment of DEGs was analysed by Gene Set Enrichment Analysis (GSEA) and Kyoto Encyclopedia of Genes and Genomes (KEGG) analysis.
QUANTITATIVE REAL-TIME POLYMERASE CHAIN REACTION:
Quantitative real-time polymerase chain reaction (qRT-PCR) was performed as previously described [19]. Complementary DNA was made by a reverse transcription system from 1 μg total RNA. GAPDH was used as an internal control for each transcript. In accordance with the manufacturer’s protocol, qRT-PCR assays were carried out with an Mx3005P RT-PCR system (Agilent Technologies Stratagene) using SYBR Premix Ex Taq (TransGen Biotech, Beijing, China). The primer sequences were as follows:
WESTERN BLOT ANALYSIS:
Western blot protein assays were conducted as previously reported [20]. Cells were treated with omipalisib and harvested by trypsinization, followed by resuspension in lysis buffer (containing 1 mM PMSF and 0.5 mM PhosSTOP) with brief sonication. The protein concentrations were determined with a protein assay kit according to the manufacturer’s instructions (Beyotime, P0010, China). Cell lysates were separated by SDS-PAGE and transferred onto PVDF membranes (GE Healthcare). After blocking with blocking buffer containing 5% nonfat milk, membranes were incubated with primary antibodies overnight at 4°C, followed by incubation with horseradish peroxidase–conjugated secondary antibody. Blots were imaged with an imaging system (MYECL, Thermo scientific). Primary antibodies, AKT (#9272), ERK (#4695), P70S6K (#9202), S6 (#2217), 4EBP1 (#9644), p-AKT (Ser473, #4060), p-ERK (Thr202/Tyr204, #4376), p-P70S6K (Ser371, #9208), p-S6 (Ser235/236, #2211), p-4EBP1 (Thr37/46, #2855), and CDKN1B (#3688) were purchased from Cell Signaling Technology. CCND1 (ab134175) was obtained from Abcam.
XENOGRAFT STUDIES:
All experimental personnel conducted experiments under the supervision and guidance of the Laboratory Animal Ethics Committee of the First Hospital of Jilin University. All procedures complied with the statute on the Administration of Laboratory Animals approved by China’s Council. Twenty-four 6- to 8-week-old female BALB/c nude mice were obtained from Vital River Laboratory Animal Technology Co, Ltd. The animals were housed under pathogen-free conditions. A total of 2.5×10⁵ KYSE150 cells in 50 μl PBS was injected subcutaneously into the right dorsal area of the nude mice. When the average tumor volumes reached approximately 100 mm3, the mice were assigned randomly into 4 groups (n=6 per group). Vehicle and various doses of omipalisib (1, 2, and 3 mg/kg) were administered once daily, 5 days per week by gavage for 4 weeks. Tumor volumes and body weights were measured every 2 days. At the end of the experiment, the mice were killed, and the tumor tissues were harvested and stored at −80°C for further Western blot analysis.
STATISTICAL ANALYSIS:
Data are represented as mean±standard deviation (SD) unless otherwise stated. Statistical analysis was performed using SPSS21.0 software. Two-tailed unpaired
Results
CHEMICAL SCREENING:
A pilot screening of 1404 compounds from an FDA-approved compound library was conducted by MTT assay with 3 biological replicates using a panel of 4 ESCC cell lines: KYSE150, KYSE70, KYSE520, and KYSE180 (Figure 1A). A total of 69 compounds demonstrated obvious antineoplastic effect, with an inhibitory rate above 50% for at least 1 ESCC cell line. A literature review identified 13 compounds that were reported to have pharmaceutical potential against cancers, and most of these compounds were histone deacetylase inhibitors, proteasome inhibitors, or kinase inhibitors. Of the 13 compounds, 5 had an inhibitory rate above 50% in all 4 ESCC cell lines (Figure 1B, C). Of the 5 compounds tested, 2 were proteasome inhibitors: digoxin is a Na+, K+-ATPase inhibitor; and omipalisib is a dual inhibitor for PI3K and mTOR (Table 1). Further, we compared the PIK3CA and mTOR mRNA expression levels between esophageal cancer tissues and paired normal samples in GEPIA (http://gepia.cancer-pku.cn) (Figure 2A, 2B). PIK3CA and mTOR mRNA expression levels were significantly higher in esophageal cancer tissues than in those of normal esophageal tissues (Figure 2C, 2D), indicating the PI3K/AKT/mTOR signaling pathway could be a target for esophageal cancer treatment. Therefore, we focused on omipalisib in the next experiment.
OMIPALISIB EXERTED A SIGNIFICANT ANTINEOPLASTIC EFFECT ON ESCC CELLS:
To evaluate the inhibitory effect of omipalisib, ESCC cells were treated with a series of concentrations of omipalisib for 72 hours. Omipalisib inhibited growth in all 4 ESCC cell lines in a dose-dependent manner (Figure 3A). The clone formation assay confirmed that omipalisib significantly suppressed the growth and proliferation of the 4 cell lines (Figure 3B, 3C). Moreover, omipalisib demonstrated better bioactivity against the 4 ESCC cell lines than did cisplatin, a common chemotherapy drug for patients with ESCC (Figure 3D).
OMIPALISIB INDUCED CELL CYCLE ARREST AND APOPTOSIS IN ESCC CELLS:
To demonstrate the underlying mechanisms of omipalisib, flow cytometry was used to clarify its effect on cell cycle distribution and cell apoptosis. Treatment of ESCC cells with omipalisib (0, 20, 40, 80, and 160 nM) for 24 hours led to the significant accumulation of cells in the G0/G1 phase and a reduction of cells in the S phase among all ESCC cell lines (Figure 4A). Furthermore, we identified the expression levels of cell cycle-associated proteins CCND1 and CDKN1B. Expression of CCND1 was significantly decreased with 24 hours of omipalisib treatment at doses above 20 nM in KYSE70 and KYSE150 cells, whereas CCND1 expression was significantly decreased with 160 nM omipalisib in KYSE180 and KYSE520 cells. Omipalisib decreased CDKN1B expression at the doses above 20 nM in all 4 cell lines (Figure 4B, 4C). With extended treatment time, omipalisib induced apoptosis in ESCC cells. Omipalisib treatment for 72 hours significantly increased apoptosis in ESCC cells compared to that of the control (Figure 5A, 5B).
RNA-SEQ IDENTIFIED THE MTOR SIGNALING PATHWAY AS THE PROMINENT TARGET OF OMIPALISIB:
We next examined the effects of omipalisib on global gene expression in KYSE150 cells using RNA-seq. The results of RNA-seq were deposited in the GEO database (accession no. GSE143462). Omipalisib treatment downregulated 500 genes and upregulated 1535 genes; specifically, genes in the mTOR signaling pathway were markedly altered by omipalisib treatment according to the KEGG pathway enrichment analyses (P=0.0003, q=0.1356) (Figure 6A). GSEA confirmed that the mTOR signaling pathway was involved in omipalisib treatment (Figure 6B). We verified the RNA-seq data with a qRT-PCR assay. Similarly, the expression levels of DDIT4 and CCND1 mRNA were decreased by omipalisib treatment (Figure 6C).
OMIPALISIB DECREASED PROTEIN EXPRESSION IN PI3K/AKT/MTOR AND ERK SIGNALING:
To confirm the RNA-seq data, the protein expression of the PI3K/AKT/mTOR signaling pathway was detected by Western blot analysis, which revealed that omipalisib treatment caused similar protein expression changes among the 4 ESCC cell lines. Omipalisib significantly decreased the expression of p-AKT at concentrations above 5 nM. The phosphorylation levels of P70S6K, 4EBP1, and S6, downstream proteins of the mTOR signaling pathway, were decreased by omipalisib in a dose-dependent manner (Figure 7A, 7C). Additionally, p-ERK levels were significantly decreased by the 24-hour treatment with omipalisib (Figure 7B, 7C).
:
Based on the inhibitory activity of omipalisib on ESCC in vitro, we established an ESCC xenograft model and administered omipalisib (control, 1, 2, and 3 mg/kg) for 4 weeks. At the end of treatment, the average tumor volumes were: 1036.01±183.44 (control), 485.95±160.34 (1 mg/kg), 191.04±37.56 (2 mg/kg), and 155.79±36.52 mm3 (3 mg/kg). Compared to the control, the 3 doses of omipalisib treatment significantly delayed tumor growth (Figure 8A, 8B). The body weight of the mice did not significantly change during the treatment with omipalisib, indicating it was well tolerated. (Figure 8C). We further determined the expression of p-AKT, CCND1, and p-S6 in tumor tissues by Western blotting, which showed that omipalisib treatment led to decreased p-AKT, CCND1, and p-S6 expression levels (Figure 8D, 8E). These results further illustrated that omipalisib exerted antineoplastic effects by disrupting the PI3K/AKT/mTOR signaling pathway.
Discussion
Although chemotherapy is an indispensable and important part of treatment for advanced ESCC, serious adverse effects limit its clinical application [21]. Thus, the discovery and development of novel drugs are urgently needed for the treatment of ESCC. The screening of existing drug libraries provides a convenient method to promote drug discovery and development. Using this method, we identified omipalisib as a promising therapeutic agent for ESCC.
The PI3K/AKT/mTOR pathway has been identified as a potential therapeutic target for multiple types of cancer [22–24]. Further, the inactivation of the PI3K/AKT/mTOR signaling pathway is considered an effective therapeutic strategy for ESCC [25,26]. Everolimus and temsirolimus, 2 mTOR inhibitors, have exhibited potent antineoplastic effects against ESCC [27,28]. Compared to these 2 mTOR inhibitors, omipalisib targets both PI3K and mTOR, while showing greater efficacy and fewer toxic effects [13]. Moreover, omipalisib could overcome the drug resistance of cancer cells in combinational therapy [29,30]. To the best of our knowledge, the present study is the first to investigate the antineoplastic effect of omipalisib on ESCC. RNA-seq analysis confirmed that the PI3K/AKT/mTOR pathway is the prominent target of omipalisib. We demonstrated that omipalisib suppressed the activation of AKT and the downstream targets of mTOR and significantly inhibited the proliferation of ESCC cells
Hou et al. revealed that inhibiting the phosphorylation of P70S6K and 4EBP1 induced G0/G1 arrest and apoptosis in ESCC cells [26]. Liu et al. found that omipalisib suppressed phosphorylation of the AKT, S6, and 4EBP1 proteins, thereby inducing apoptosis and cell cycle arrest [14]. Similarly, the present study showed that omipalisib inhibited the proliferation of ESCC cells by inducing G0/G1 arrest and apoptosis. The decreased CCND1 expression and increased CDKN1B expression with omipalisib treatment further confirmed that cell cycle arrest is a partial cause of omipalisib-induced decreased cell viability. Basu et al. showed that the cell death induced by omipalisib in NRAS mutant neurocutaneous melanocytosis cells occurs mainly via autophagy [31]. However, we did not find any evidence of autophagy in the ESCC cells.
There were negative feedback loops between the mTORC1 and MAPK signaling pathways, and LY294002, a PI3K inhibitor, could block feedback by reducing rapamycin-mediated MAPK/ERK activation [32]. Dual PI3K-mTOR inhibitors possibly overcome the feedback of MAPK signaling by targeting PI3K and mTOR simultaneously [33]. Consistent with our results, it was recently reported that BEZ235, another dual PI3K-mTOR inhibitor, has an inhibitory effect on ESCC, but its effect on feedback inhibition was not mentioned [34]. Our results demonstrated that omipalisib suppressed the activation of both PI3K/AKT/mTOR and ERK signaling in all ESCC cell lines, indicating that omipalisib can suppress the feedback activation of MAPK. Because the PI3K/AKT/mTOR and MAPK signaling pathways play crucial roles in cell proliferation and survival, omipalisib on its own can act effectively in ESCC cells.
Conclusions
In summary, omipalisib inhibited the proliferation of ESCC cells by inducing cell cycle arrest and apoptosis by inactivating PI3K/AKT/mTOR and ERK signaling. The present study supports the rationale for using omipalisib as a therapy for ESCC and could promote the rapid clinical evaluation of this therapeutic approach.
Figures
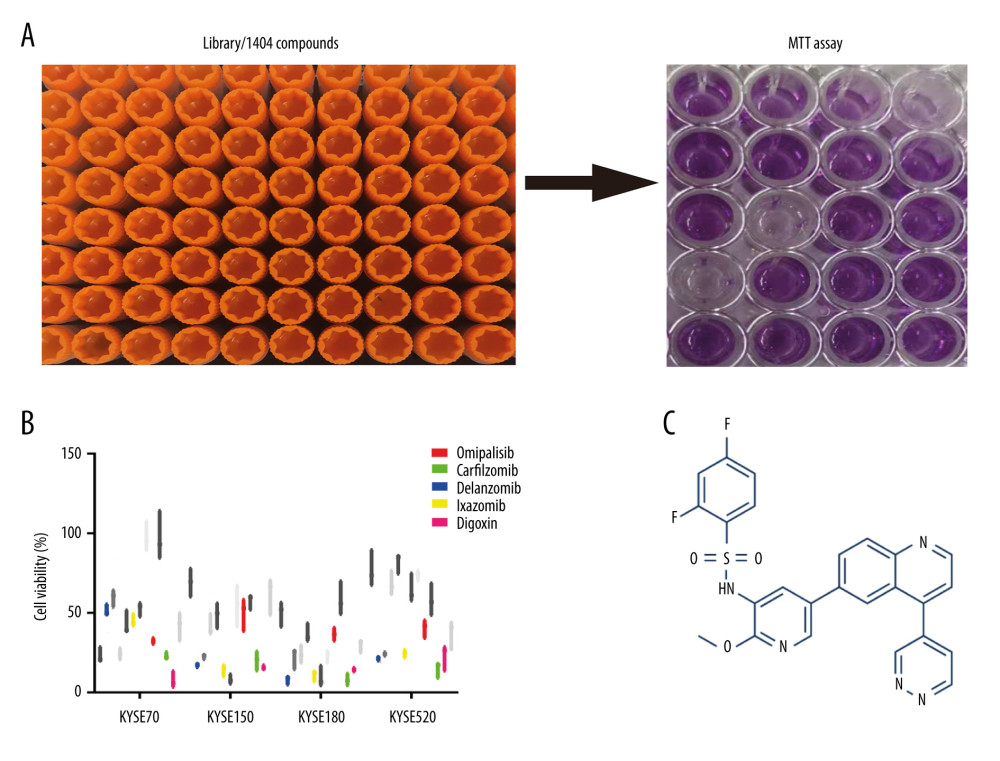 Figure 1. Omipalisib was identified as a potential agent against Esophageal squamous cell carcinoma (ESCC). (A) MTT assay was used to screen compounds in a 1404-compound library. (B) In total, 13 compounds showed inhibitory effects on 4 ESCC cell lines. (C) Chemical structure of omipalisib.
 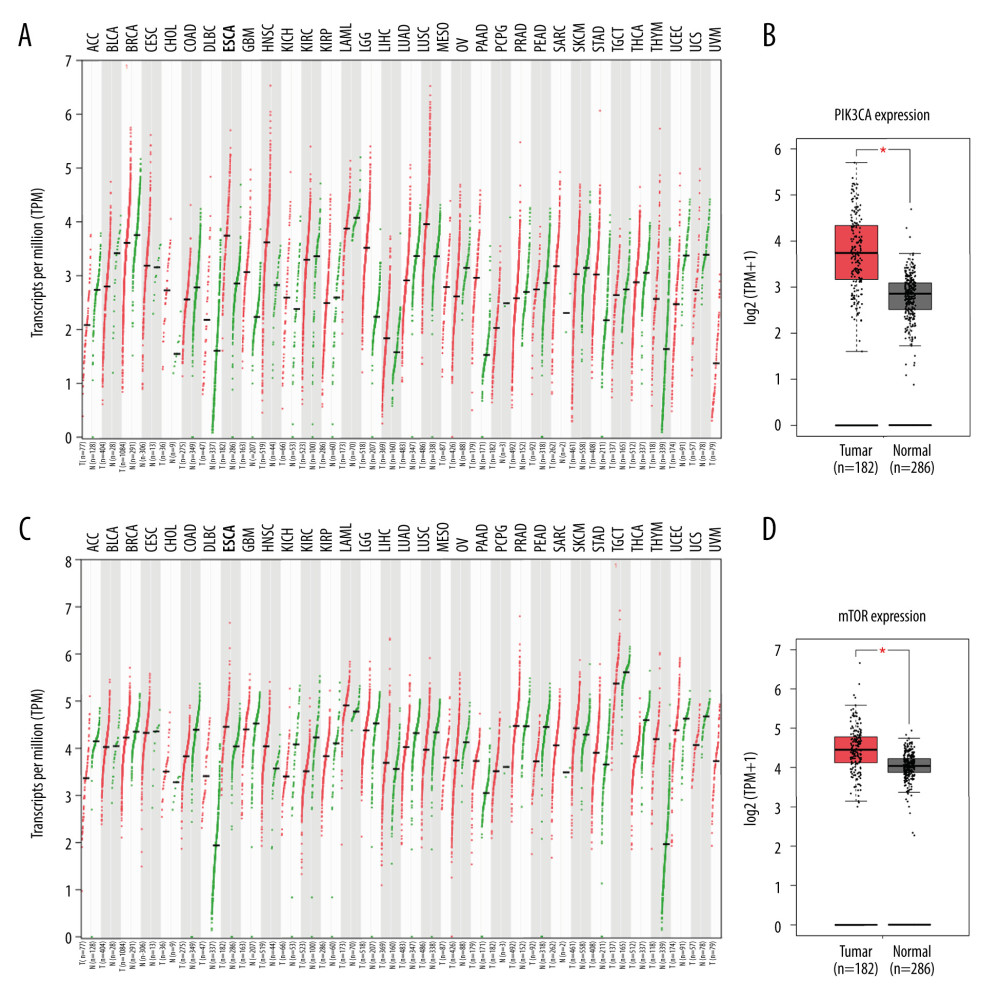 Figure 2. PIK3CA and mTOR were highly expressed in Esophageal squamous cell carcinoma (ESCC) patients. (A, B) The PIK3CA and mTOR expression levels in all tumor samples. (C, D) The PIK3CA and mTOR mRNA expression in esophageal cancer samples and normal tissues (* P<0.05).
 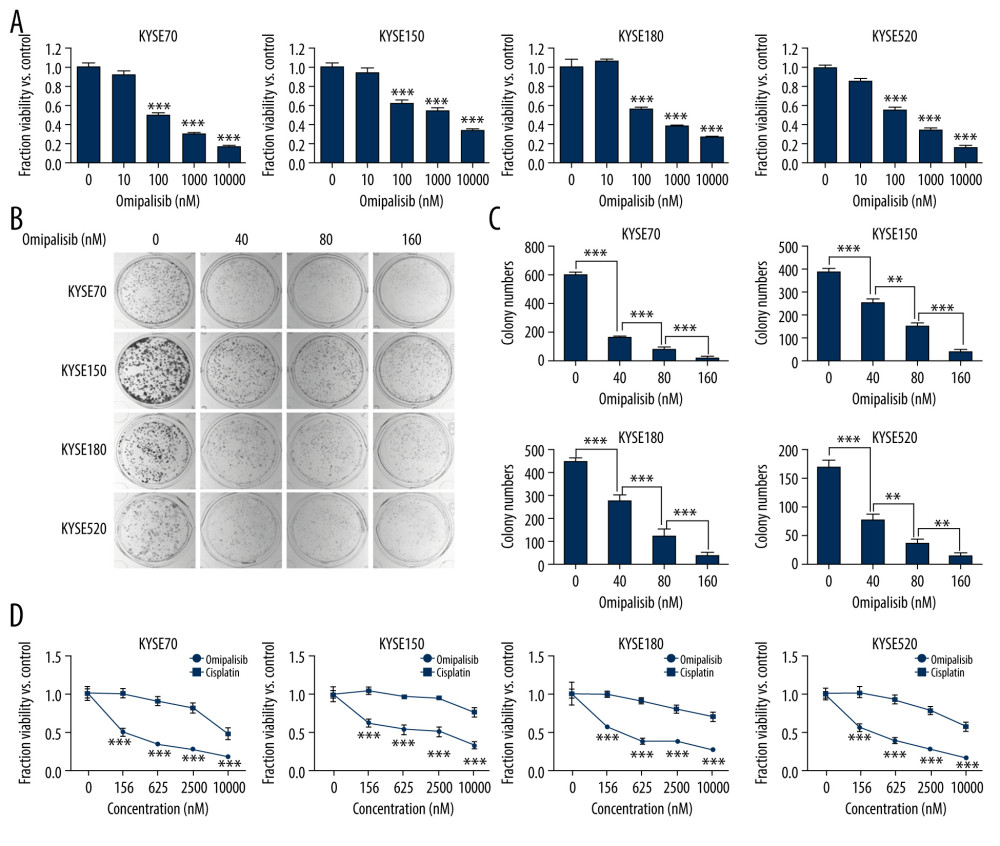 Figure 3. Omipalisib inhibited the proliferation of Esophageal squamous cell carcinoma (ESCC) cells. (A) Representative data of 3 independent experiments in cell viability of ESCC exposed to a series of concentrations of omipalisib for 72 hours. (B, C) Representative image of clone formation assay for ESCC cells treated with omipalisib for 72 hours. Clone numbers were calculated. (D) ESCC cells were treated with a series of omipalisib and cisplatin concentrations for 72 hours, and cell viability was measured by MTT assay. (* P<0.05, ** P<0.01, *** P<0.001).
 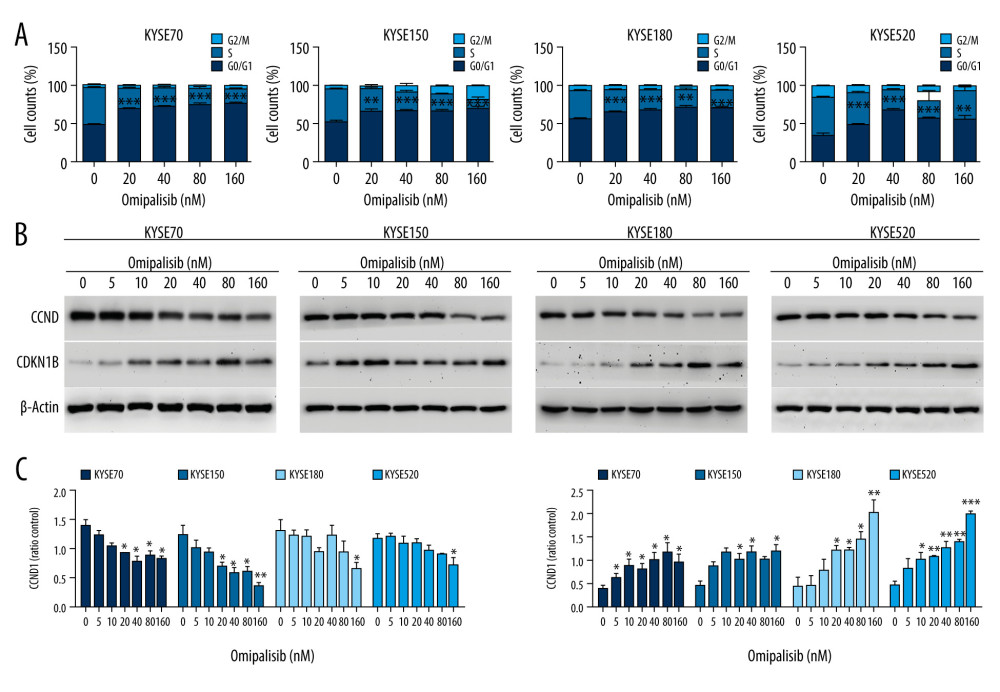 Figure 4. Omipalisib induced cell cycle arrest of Esophageal squamous cell carcinoma (ESCC) cells. (A) Representative data of 3 independent experiments in cell cycle distribution determined by flow cytometry in ESCC cells exposed to omipalisib for 24 hours. (B) Representative image of protein expression of 3 independent experiments in 4 ESCC cells exposed to omipalisib for 24 hours. (C) Density analysis of protein bands performed with ImageJ software. Plot is the average of 3 independent experiments. (* P<0.05, ** P<0.01, *** P<0.001).
 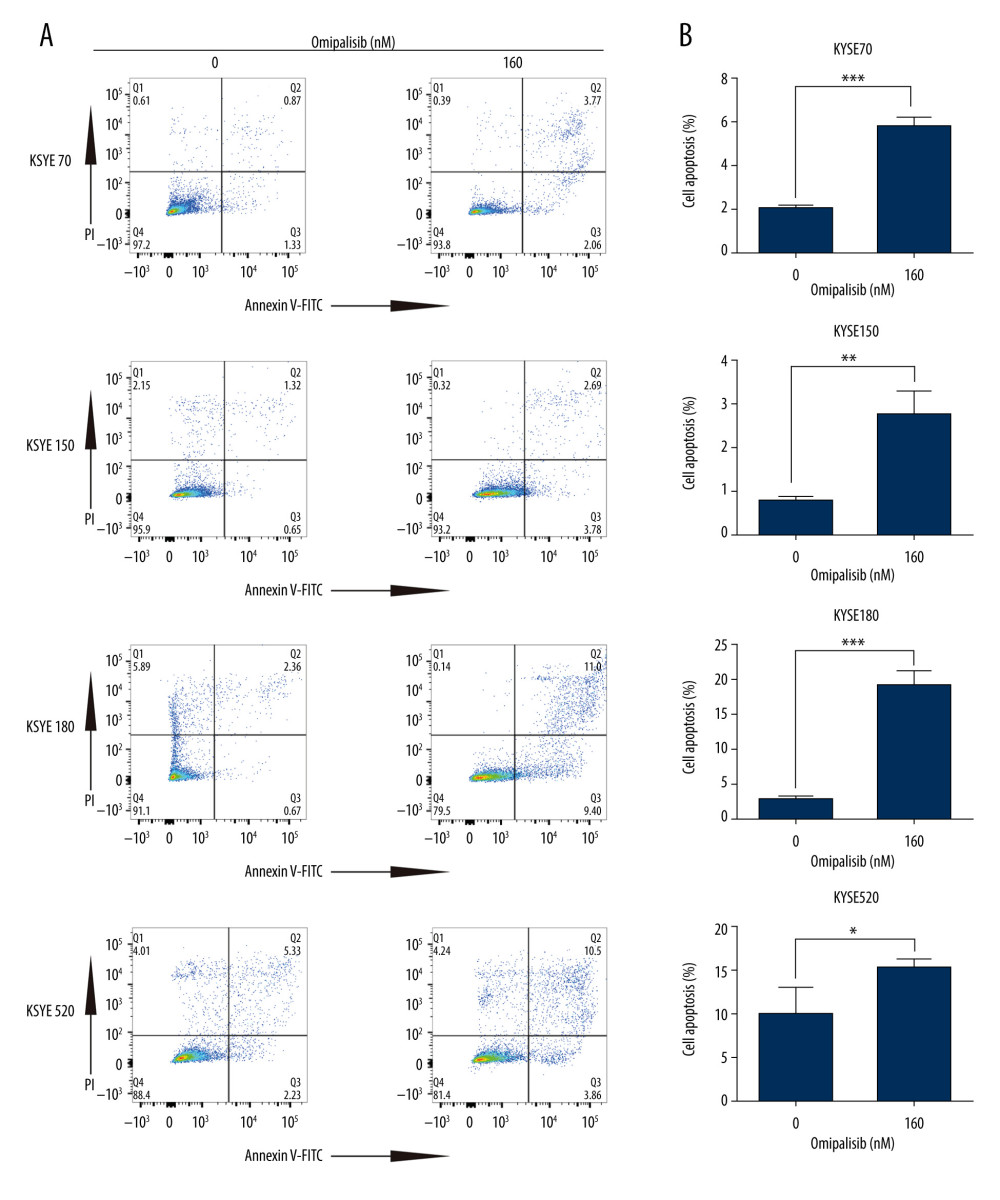 Figure 5. Omipalisib induced apoptosis in Esophageal squamous cell carcinoma (ESCC) cells. (A) Representative image of apoptosis in ESCC cells. (B) Apoptotic cells in ESCC cells was quantified. (* P<0.05, ** P<0.01, *** P<0.001).
 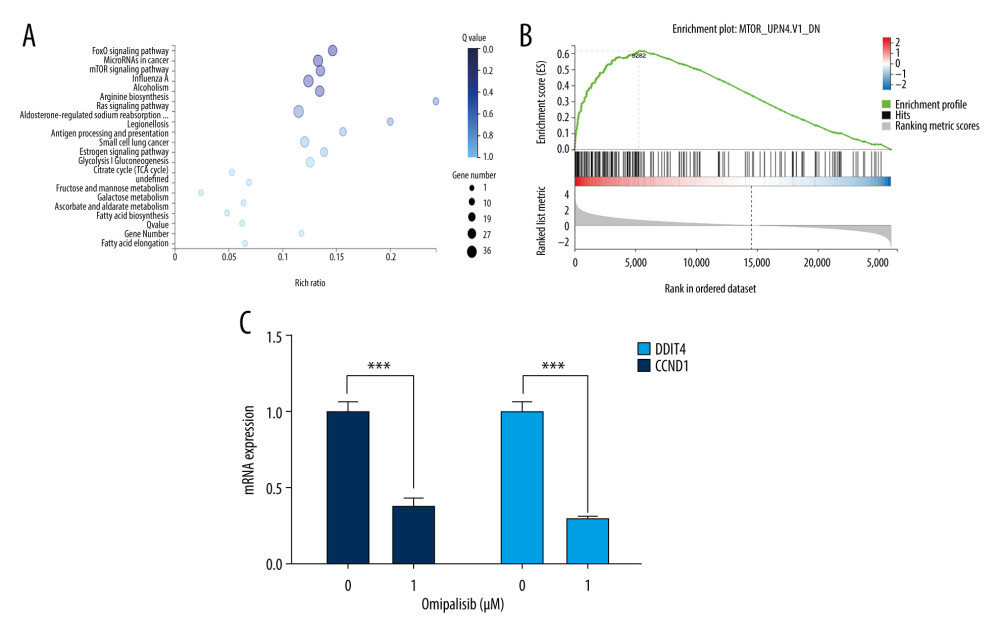 Figure 6. Identification of potential signaling pathways of omipalisib with RNA-seq assays. (A, B) DEGs indicated that the mTOR signaling pathway is the major pathway affected by omipalisib treatment according to KEGG pathway enrichment analysis (A) and GSEA (B). (C) qRT-PCR assays showed obvious alterations in DDIT4 and CCND1 gene expression, and the tendency was consistent with the RNA-seq results. (*** P<0.001).
 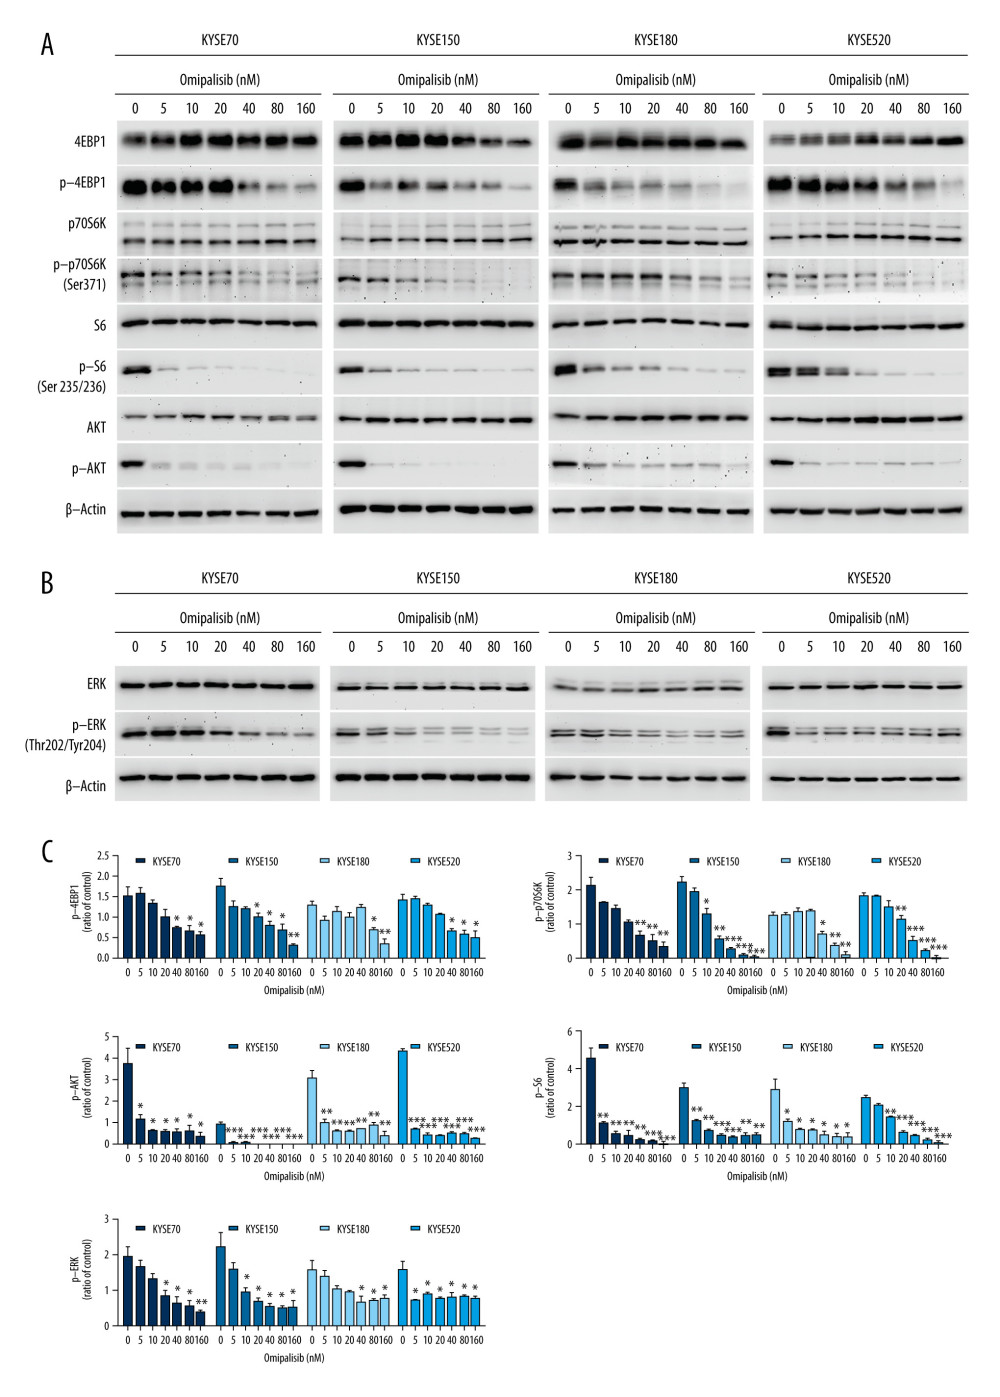 Figure 7. Omipalisib decreased phosphorylation of proteins in mTOR and ERK signaling pathway. (A) Esophageal squamous cell carcinoma (ESCC) cells were treated with the various concentrations of omipalisib for 24 hours. The protein expression levels of 4EBP1, p-4EBP1, p70S6K, p-p70S6k, S6, p-S6, AKT, and p-AKT were identified by Western blot analysis. (B) ERK and p-ERK protein levels in the 4 ESCC cell lines treated with omipalisib at the indicated concentrations for 24 hours. (C) Density analysis of protein bands performed with ImageJ software. Plot is the average of 3 independent experiments. (* P<0.05, ** P<0.01, *** P<0.001).
 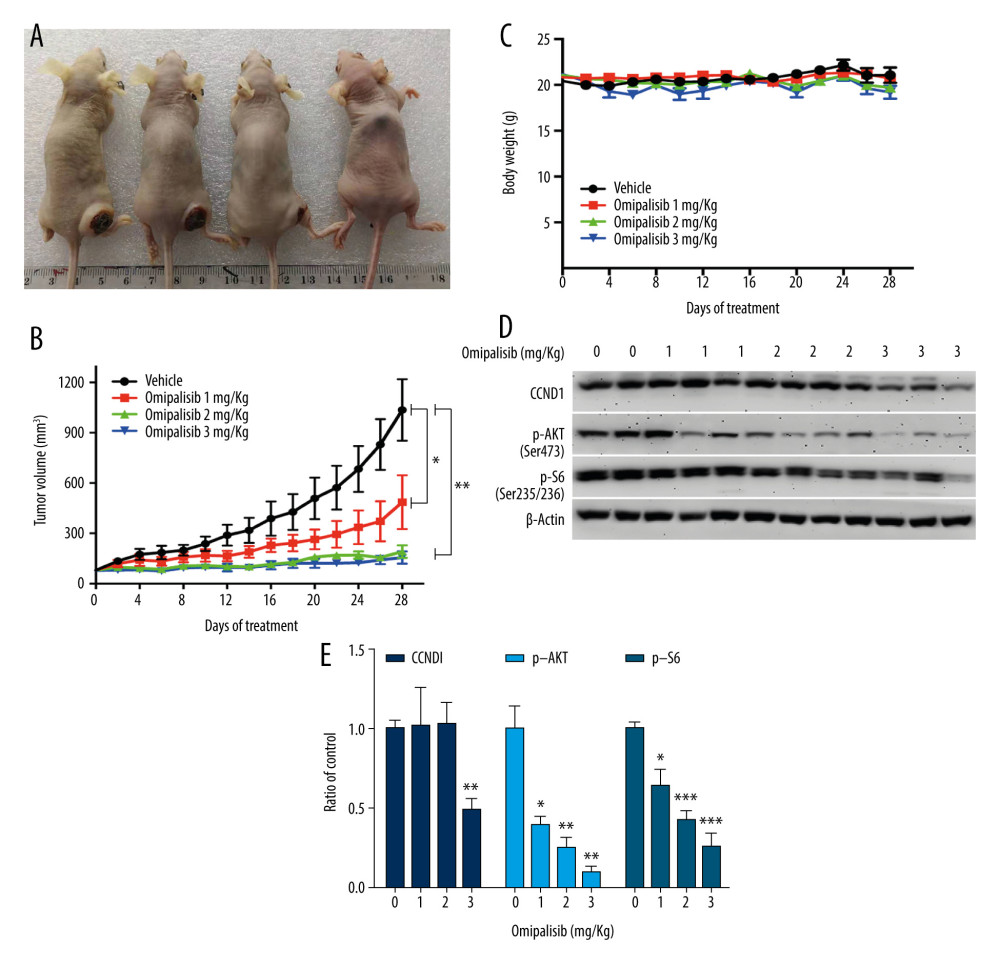 Figure 8. Omipalisib inhibited the growth of Esophageal squamous cell carcinoma (ESCC) in vivo. (A) Representative image of mice administered different doses of omipalisib at the end of the experiment. (B) Tumor volume was calculated by the following equation: volume=long diameter×(short diameter)2/2. (C) Body weight was recorded every 2 days during the course of omipalisib administration. (D) Protein expression in tumor tissue from KYSE150-bearing mice by Western blot. (E) Density analysis of protein bands were performed with ImageJ software. (* P<0.05, ** P<0.01, *** P<0.001).
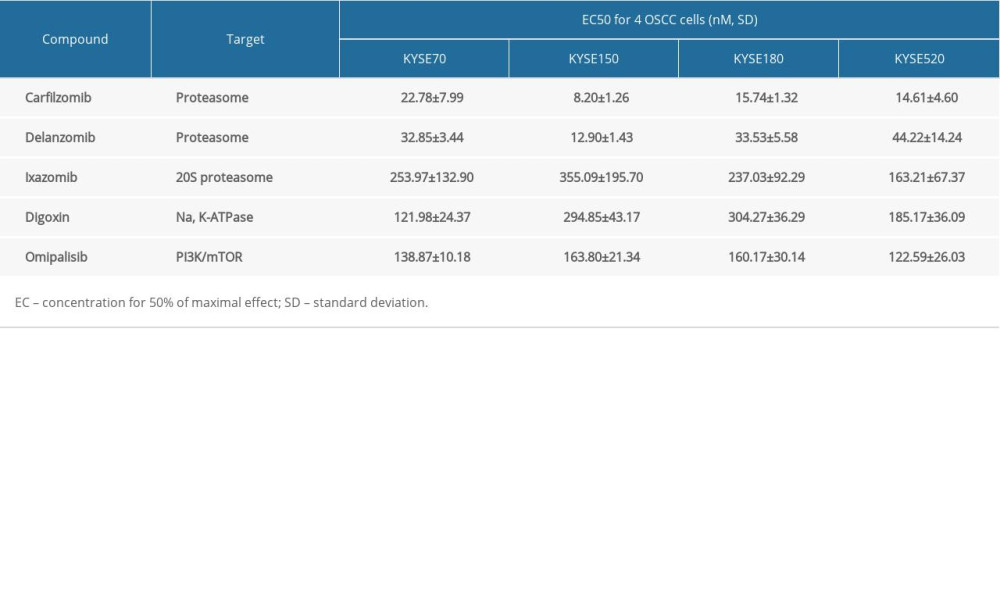
References
1. Bray F, Ferlay J, Soerjomataram I, Global cancer statistics 2018: GLOBOCAN estimates of incidence and mortality worldwide for 36 cancers in 185 countries: Cancer J Clin, 2018; 68(6); 394-424
2. Arnold M, Soerjomataram I, Ferlay J, Forman D, Global incidence of esophageal cancer by histological subtype in 2012: Gut, 2015; 64(3); 381-87
3. Pennathur A, Gibson MK, Jobe BA, Luketich JD, Esophageal carcinoma: Lancet, 2013; 381(9864); 400-12
4. Murray JC, Levy B, Repurposed drugs trials by cancer type: Lung cancer: Cancer J, 2019; 25(2); 127-33
5. Li M, Yang J, Zhang L, A low-molecular-weight compound exerts anticancer activity against breast and lung cancers by disrupting EGFR/Eps8 complex formation: J Exp Clin Cancer Res, 2019; 38(1); 211
6. Gupta SC, Sung B, Prasad S, Cancer drug discovery by repurposing: teaching new tricks to old dogs: Trends Pharmacol Sci, 2013; 34(9); 508-17
7. Schmelzle T, Hall MN, TOR, a central controller of cell growth: Cell, 2000; 103(2); 253-62
8. Hay N, Sonenberg N, Upstream and downstream of mTOR: Genes Dev, 2004; 18(16); 1926-45
9. Dancey J, mTOR signalling and drug development in cancer: Nat Rev Clin Oncol, 2010; 7(4); 209-19
10. Shor B, Gibbons JJ, Abraham RT, Yu K, Targeting mTOR globally in cancer: Thinking beyond rapamycin: Cell Cycle, 2009; 8(23); 3831-37
11. Cancer Genome Atlas Research Network. Analysis Working Group: Asan University, BC Cancer Agency, et al, Integrated genomic characterization of esophageal carcinoma: Nature, 2017; 541(7636); 169-75
12. Hirashima K, Baba Y, Watanabe M, Phosphorylated mTOR expression is associated with poor prognosis for patients with esophageal squamous cell carcinoma: Ann Surg Oncol, 2010; 17(9); 2486-93
13. Knight SD, Adams ND, Burgess JL, Discovery of GSK2126458, a highly potent inhibitor of PI3K and the mammalian target of rapamycin: ACS Med Chem Lett, 2010; 1(1); 39-43
14. Liu T, Sun Q, Li Q, Dual PI3K/mTOR inhibitors, GSK2126458 and PKI-587, suppress tumor progression and increase radiosensitivity in nasopharyngeal carcinoma: Mol Cancer Ther, 2015; 14(2); 429-39
15. Albawardi A, Al Ayyan M, Al Bashir M: Cancer Cell Int, 2014; 14(1); 90
16. Munster P, Aggarwal R, Hong D, First-in-human phase I study of GSK2126458, an oral pan-class I phosphatidylinositol-3-kinase inhibitor, in patients with advanced solid tumor malignancies: Clin Cancer Res, 2016; 22(8); 1932-39
17. Li B, Li YY, Tsao SW, Cheung AL, Targeting NF-kappaB signalling pathway suppresses tumor growth, angiogenesis, and metastasis of human esophageal cancer: Mol Cancer Ther, 2009; 8(9); 2635-44
18. Wang L, Feng Z, Wang X, DEGseq: An R package for identifying differentially expressed genes from RNA-seq data: Bioinformatics, 2010; 26(1); 136-38
19. Wang M, Liu B, Li D, Upregulation of IBSP expression predicts poor prognosis in patients with esophageal squamous cell carcinoma: Front Oncol, 2019; 25(9); 1117
20. Sweetlove M, Wrightson E, Kolekar S, Inhibitors of pan-PI3K signalling synergize with BRAF or MEK inhibitors to prevent BRAF-mutant melanoma cell growth: Front Oncol, 2015; 16(5); 135
21. Oun R, Moussa YE, Wheate NJ, Correction: The side effects of platinum-based chemotherapy drugs: A review for chemists: Dalton Trans, 2018; 47(23); 7848
22. Kim HG, Tan L, Weisberg EL, Discovery of a potent and selective DDR1 receptor tyrosine kinase inhibitor: ACS Chem Biol, 2013; 8(10); 2145-50
23. McKinnon T, Venier R, Yohe M, Functional screening of FGFR4-driven tumorigenesis identifies PI3K/mTOR inhibition as a therapeutic strategy in rhabdomyosarcoma: Oncogene, 2018; 37(20); 2630-44
24. Dolman ME, Westerhout EM, Hamdi M, Liquid chromatography-tandem mass spectrometric assay for the PI3K/mTOR inhibitor GSK2126458 in mouse plasma and tumor homogenate: J Pharm Biomed Anal, 2015; 107; 403-8
25. Engelman JA, Luo J, Cantley LC, The evolution of phosphatidylinositol 3-kinases as regulators of growth and metabolism: Nat Rev Genet, 2006; 7(8); 606-19
26. Hou G, Xue L, Lu Z, An activated mTOR/p70S6K signalling pathway in esophageal squamous cell carcinoma cell lines and inhibition of the pathway by rapamycin and siRNA against mTOR: Cancer Lett, 2007; 253(2); 236-48
27. Mohamed A, El-Rayes B, Khuri FR, Saba NF, Targeted therapies in metastatic esophageal cancer: Advances over the past decade: Crit Rev Oncol Hematol, 2014; 91(2); 186-96
28. Nishikawa T, Takaoka M, Ohara T, Antiproliferative effect of a novel mTOR inhibitor temsirolimus contributes to the prolonged survival of orthotopic esophageal cancer-bearing mice: Cancer Biol Ther, 2013; 14(3); 230-36
29. Villanueva J, Infante JR, Krepler C, Concurrent MEK2 mutation and BRAF amplification confer resistance to BRAF and MEK inhibitors in melanoma: Cell Rep, 2013; 4(6); 1090-99
30. Park KS, Yang H, Choi J, The HSP90 inhibitor, NVP-AUY922, attenuates intrinsic PI3K inhibitor resistance in KRAS-mutant non-small cell lung cancer: Cancer Lett, 2017; 406; 47-53
31. Basu D, Salgado CM, Bauer B, The dual PI3K/mToR inhibitor omipalisib/GSK2126458 inhibits clonogenic growth in oncogenically-transformed cells from neurocutaneous melanocytosis: Cancer Genom Proteom, 2018; 15(4); 239-48
32. Carracedo A, Ma L, Teruya-Feldstein J, Inhibition of mTORC1 leads to MAPK pathway activation through a PI3K-dependent feedback loop in human cancer: J Clin Invest, 2008; 118(9); 3065-74
33. Courtney KD, Corcoran RB, Engelman JA, The PI3K pathway as drug target in human cancer: J Clin Oncol, 2010; 28(6); 1075-83
34. Shi N, Yu H, Chen T, Inhibition of esophageal cancer growth through the suppression of PI3K/AKT/mTOR signaling pathway: Onco Targets Ther, 2019; 12; 7637-47
Figures
Figure 1. Omipalisib was identified as a potential agent against Esophageal squamous cell carcinoma (ESCC). (A) MTT assay was used to screen compounds in a 1404-compound library. (B) In total, 13 compounds showed inhibitory effects on 4 ESCC cell lines. (C) Chemical structure of omipalisib.Figure 2. PIK3CA and mTOR were highly expressed in Esophageal squamous cell carcinoma (ESCC) patients. (A, B) The PIK3CA and mTOR expression levels in all tumor samples. (C, D) The PIK3CA and mTOR mRNA expression in esophageal cancer samples and normal tissues (* P<0.05).Figure 3. Omipalisib inhibited the proliferation of Esophageal squamous cell carcinoma (ESCC) cells. (A) Representative data of 3 independent experiments in cell viability of ESCC exposed to a series of concentrations of omipalisib for 72 hours. (B, C) Representative image of clone formation assay for ESCC cells treated with omipalisib for 72 hours. Clone numbers were calculated. (D) ESCC cells were treated with a series of omipalisib and cisplatin concentrations for 72 hours, and cell viability was measured by MTT assay. (* P<0.05, ** P<0.01, *** P<0.001).Figure 4. Omipalisib induced cell cycle arrest of Esophageal squamous cell carcinoma (ESCC) cells. (A) Representative data of 3 independent experiments in cell cycle distribution determined by flow cytometry in ESCC cells exposed to omipalisib for 24 hours. (B) Representative image of protein expression of 3 independent experiments in 4 ESCC cells exposed to omipalisib for 24 hours. (C) Density analysis of protein bands performed with ImageJ software. Plot is the average of 3 independent experiments. (* P<0.05, ** P<0.01, *** P<0.001).Figure 5. Omipalisib induced apoptosis in Esophageal squamous cell carcinoma (ESCC) cells. (A) Representative image of apoptosis in ESCC cells. (B) Apoptotic cells in ESCC cells was quantified. (* P<0.05, ** P<0.01, *** P<0.001).Figure 6. Identification of potential signaling pathways of omipalisib with RNA-seq assays. (A, B) DEGs indicated that the mTOR signaling pathway is the major pathway affected by omipalisib treatment according to KEGG pathway enrichment analysis (A) and GSEA (B). (C) qRT-PCR assays showed obvious alterations in DDIT4 and CCND1 gene expression, and the tendency was consistent with the RNA-seq results. (*** P<0.001).Figure 7. Omipalisib decreased phosphorylation of proteins in mTOR and ERK signaling pathway. (A) Esophageal squamous cell carcinoma (ESCC) cells were treated with the various concentrations of omipalisib for 24 hours. The protein expression levels of 4EBP1, p-4EBP1, p70S6K, p-p70S6k, S6, p-S6, AKT, and p-AKT were identified by Western blot analysis. (B) ERK and p-ERK protein levels in the 4 ESCC cell lines treated with omipalisib at the indicated concentrations for 24 hours. (C) Density analysis of protein bands performed with ImageJ software. Plot is the average of 3 independent experiments. (* P<0.05, ** P<0.01, *** P<0.001).Figure 8. Omipalisib inhibited the growth of Esophageal squamous cell carcinoma (ESCC) in vivo. (A) Representative image of mice administered different doses of omipalisib at the end of the experiment. (B) Tumor volume was calculated by the following equation: volume=long diameter×(short diameter)2/2. (C) Body weight was recorded every 2 days during the course of omipalisib administration. (D) Protein expression in tumor tissue from KYSE150-bearing mice by Western blot. (E) Density analysis of protein bands were performed with ImageJ software. (* P<0.05, ** P<0.01, *** P<0.001). In Press
06 Mar 2024 : Clinical Research
Comparison of Outcomes between Single-Level and Double-Level Corpectomy in Thoracolumbar Reconstruction: A ...Med Sci Monit In Press; DOI: 10.12659/MSM.943797
21 Mar 2024 : Meta-Analysis
Economic Evaluation of COVID-19 Screening Tests and Surveillance Strategies in Low-Income, Middle-Income, a...Med Sci Monit In Press; DOI: 10.12659/MSM.943863
10 Apr 2024 : Clinical Research
Predicting Acute Cardiovascular Complications in COVID-19: Insights from a Specialized Cardiac Referral Dep...Med Sci Monit In Press; DOI: 10.12659/MSM.942612
06 Mar 2024 : Clinical Research
Enhanced Surgical Outcomes of Popliteal Cyst Excision: A Retrospective Study Comparing Arthroscopic Debride...Med Sci Monit In Press; DOI: 10.12659/MSM.941102
Most Viewed Current Articles
17 Jan 2024 : Review article
Vaccination Guidelines for Pregnant Women: Addressing COVID-19 and the Omicron VariantDOI :10.12659/MSM.942799
Med Sci Monit 2024; 30:e942799
14 Dec 2022 : Clinical Research
Prevalence and Variability of Allergen-Specific Immunoglobulin E in Patients with Elevated Tryptase LevelsDOI :10.12659/MSM.937990
Med Sci Monit 2022; 28:e937990
16 May 2023 : Clinical Research
Electrophysiological Testing for an Auditory Processing Disorder and Reading Performance in 54 School Stude...DOI :10.12659/MSM.940387
Med Sci Monit 2023; 29:e940387
01 Jan 2022 : Editorial
Editorial: Current Status of Oral Antiviral Drug Treatments for SARS-CoV-2 Infection in Non-Hospitalized Pa...DOI :10.12659/MSM.935952
Med Sci Monit 2022; 28:e935952