18 June 2020: Database Analysis
Using the TCGA Database to Predict and Analyze Tumor Microenvironment Genes Related to Poor Prognosis of Colon Cancer
Sihan Chen1A*, Lu Yida1C, Bo Chen1G, MaoMing Xiong1GDOI: 10.12659/MSM.923707
Med Sci Monit 2020; 26:e923707


Abstract
BACKGROUND: Colon cancer (COAD) is a highly malignant gastrointestinal cancer. The existence of the TCGA database allows us to more easily perform gene expression profiling and data mining on colon cancer patients worldwide, and to more easily discover the correlation between genes and survival prognosis of colon cancer. Related reports show that the degree of infiltration of tumor immune cells and stromal cells in tumor microenvironment cells has a significant impact on the prognosis of cancer patients.
MATERIAL AND METHODS: The immune and stromal components in colon cancer can be quantitatively analyzed using relevant scores obtained by use of the ESTIMATE calculation method. To better explain the effect of relevant genes of cells associated with immunity and stroma on the survival prognosis of colon cancer, we divided the data from 191 downloaded case into high and low groups according to their scores of immunity and stroma, and identified differentially expressed genes.
RESULTS: The results showed that immune and stromal scores were significantly associated with survival prognosis. After performing biological function enrichment analysis and protein interaction network on the target genes, the results showed that these genes are mainly involved in inflammatory response, immune response, and chemotaxis. We then performed relevant survival prognosis analysis of these genes.
CONCLUSIONS: We found a number of genes that possess the properties of tumor immune microenvironment and can predict poor prognosis of colon cancer.
Keywords: tumor microenvironment, Aged, 80 and over, Colonic Neoplasms, Databases, Genetic, Survival Rate
Background
COAD is a malignant cancer of the digestive tract. It can be divided into right colon cancer and left colon cancer according to the location of the cancer, but they both are lower digestive tract cancers. According to a WHO study in 2018, there were approximately 1.8 million COAD patients worldwide, accounting for 10.2% of all tumors. The number of deaths due to COAD in 2018 reached 881 000 [1–3].
There are many types of treatments for COAD, such as surgical removal of cancerous lesions, target gene chemotherapy, and radiation therapy. However, there is currently no therapeutic means to completely cure colon cancer in all cases. There is therefore the need to further explore colon cancer treatment options to obtain a higher colon cancer cure rate. Because of the establishment of a tumor genome databases such as TCGA, we can better understand the impact of genetic composition on clinical prognosis, and can mine and analyze data from large cohorts around the world. According to information in the TCGA database, the historical type of colon cancer can be divided into 2 categories: Colon Mucinous Adenocarcinoma and Colon Adenocarcinoma. According to the NCCN2019 version of the guidelines, AFP, CEA, and CA199 mutations can be used as references for disease diagnosis [4]. Today, gene expression profiles are increasingly being recognized as part of the standard for clinical diagnosis.
According to research by Di Jia et al., the ESTIMATE algorithm-derived immune score and stromal score can be used for glioblastoma (GBM) patients. We used the same method to collect and extract a series of microenvironment-related genetic data in the TCGA database and further explored the effect on the colon genes for prognosis in colon cancer patients [5].
The purpose of this study was to use bioinformatics-related databases and tools to analyze and obtain relevant genes that constitute the tumor microenvironment and affect the survival prognosis of patients with colon cancer.
Material and Methods
RELEVANT DATA ACQUISITION:
We obtained data on 191 colon cancer patients from the TCGA database and data on RNA expression for colon cancer using AgilentG4502A_07_3 [6]. Clinically relevant data, such as age, sex, tumor pathology classification, survival rate, and histological type were obtained from the TCGA database. Relevant immune scores and stromal scores were obtained from the ESTIMATE algorithm database [7].
DIFFERENTIALLY EXPRESSED GENES (DEGS) INCLUSION CRITERIA:
Data that fold change ≤|1.0| and adj. p value ≤0.05 were included as selected genes.
HEATMAPS PRODUCTION AND ANALYSIS:
Data analysis and heat map production were performed using the ClusterVis database [8].
VOLCANO MAPPING:
Data with fold change ≤| 1.0 | and adj. P value ≤0.05 were included as selected standard, and then plotted in the volcano map.
CONSTRUCTION AND MODIFICATION OF PPI NETWORK:
We used the STRING database to build a PPI network, and used Cytoscape software to modify it [9,10]. We used the Cytoscape-related plug-in ClueGO [11] to further explore the potential immune system functions of DEGs.
CORRELATION SURVIVAL ANALYSIS AND SURVIVAL CURVE PLOTTING:
Survival-related data were analyzed using the log-rank test, and Kaplan-Meier plots were used to assess the relationship between related DEGs and survival data.
DEGS FOR GO; KEGG; IMMUNE FUNCTION ANALYSIS:
We used the DAVID database [12] for functional enrichment analysis of DEGs, such as GO analysis and KEGG pathway analysis. The false discovery rate (FDR) was considered statistically significant.
Results
CORRELATION BETWEEN HISTOLOGICAL TYPE OF COLON CANCER AND IMMUNE SCORES OR STROMAL SCORES:
We downloaded 191 colon cancer patient data from the TCGA database, such as patient age, tumor size, tumor grade, and tumor location. Patient ages ranged from 30 to 90 years. Of the 191 patients, 105 (55%) were male and 86 (45%) were female. Histological typing of 191 patients revealed that 48 (25%) had colon mucinous adenocarcinoma and 143 (75%) had colon adenocarcinoma. Patients with different histology types had different prognoses. We analyzed the selected patient data based on the ESTIMATE algorithm and obtained immune scores and stromal scores. Stromal scores ranged from −2053.75 to 976.26, and immune score ranged from −477.96 to 1511.97. Colon mucinous adenocarcinoma had higher stromal scores and immune scores than colon adenocarcinoma. The results show that both stromal score and immune score have significance in the correlation of historical type (Figure 1A, 1B).
According to the 2019 NCCN Clinical Practice Guidelines for Colon Cancer, CEA, AFP, and CA199 are related to the diagnosis and prognosis of colon cancer. However, the data we collected only contained data on AFP gene mutations, so we used AFP mutations for verification. According to the related gene mutation chart, the results show that the stromal score and immune score of the genetic mutation cases have no statistical significance (Figure 1C, 1D).
We divided the immune score of 191 patients in half into a high immune score group and a low immune score group, and compared the survival prognosis between the high immune score group and the low immune score group. The results showed that the survival rate of the high immune score group was significantly lower than in the low immune score group, and demonstrated a significant relationship between immune score and survival prognosis (p=0.0182). Using the same method, we compared the difference in survival prognosis between high and low matrix fractions. The results show that before 1000 days, the survival rate of the high stromal score group was significantly lower than that of the low stromal scores group, but after 1000 days there, they were similar (p=0.7368) (Figure 1E, 1F).
RELATIONSHIP BETWEEN IMMUNE SCORE/STROMAL SCORE AND GENE EXPRESSION IN COLON CANCER:
We compared our downloaded 191 patient data with Affymetrix microarray data, and created heatmaps based on high and low immune score/stromal score groups for visual analysis (Figure 2A, 2B). According to the inclusion criteria fold change >1, adj. P<0.05, 2 volcano maps showed 212 upregulated genes and 7 downregulated genes in the immune score group, and 155 upregulated genes and 8 downregulated genes in the stromal score group (Figure 2C, 2D). The Venn diagram summary (Figure 2E, 2F) shows there are 78 upregulated genes and 2 downregulated genes in both the immune score group and the stromal score group. We therefore focussed on these differentially expressed genes (DEGs) [8,13].
To understand the potential biological functions of DEGs, we performed an enrichment analysis on 78 DEGs that were upregulated. The TOP10 of the gene ontology (GO) and KEGG pathway analysis showed that biological processes, cellular components, and cellular components are closely related to immune mechanisms, such as inflammatory response, immune response, and chemotaxis (Figure 3A–3D).
MAPPING OF PROTEIN-PROTEIN INTERACTION (PPI) NETWORKS FOR DEGS:
To better understand the interaction between DEGs, we used the STRING database to draw a PPI network. The PPI network was composed of 3 module groups, including 78 nodes and 415 edges (Figure 4). The circle size represents the size of the Degree value, and the color shade represents the size of the LogFC value. The thickness of the line represents the combined score between the proteins. Through the PPI network, we found that some immune response genes, such as CCL8, IL18RAP, P2RY14, FPR3, CD163, CCL2, FCGR2B, AIF1, TLR2, and TNFSF13B, are in a relatively core positions in the PPI network and play an important role in protein interactions. ClueGO immune system analysis of DEGs in the PPI network showed that negative regulation of dendritic cell differentiation occupies the main part (60.42%) (Figure 4A, 4B).
DEGS-RELATED SURVIVAL PROGNOSIS ANALYSIS AND PLOTTING SURVIVAL CURVES:
To further explore the relationship between DEGs and colon cancer survival rates, we used the TCGA database to download the data we needed for survival analysis and plotted Kaplan-Meier survival curves. The results showed that among 78 DEGs, 17 genes had poor overall survival (log-rank <0.05). Five of these genes belong to the immune response pathway (Figure 5A, 5B).
CELLULAR COMPONENT ANALYSIS OF DEGS WITH POOR SURVIVAL PROGNOSIS:
We performed related cellular component analysis of DEGs associated with poor prognosis of colon cancer. The results showed that genes were mainly concentrated in extracellular space, integral component of membrane, and plasma membrane. The specific gene distribution is shown in Table 1.
Discussion
In this study, we downloaded data on 191 patients from the TCGA database. We tried to identify genes associated with colon cancer tumor microenvironment that are correlated with colon cancer survival prognosis in the TCGA database. First, we distinguished between high-score and low-score immune score and stromal score groups, and assessed the intersection of the 2 high-score groups. A total of 78 genes were co-expressed in the immune score group and the stromal score group, and a total of 78 genes were co-expressed in the immune score group and the stromal score group (Figure 6).
Next, further biological function enrichment analysis was performed. The results showed that the functions of these genes include inflammatory response, immune response, chemotaxis, chemokine-mediated signaling pathway, and innate immune response and regulation of immune response (Figure 2). According to the results of biological enrichment analysis, the biological functions of these genes are closely related to the tumor microenvironment [14–28].
Finally, through the information downloaded from the TCGA database, we identified 78 genes related to the tumor immune microenvironment, which have a significant relationship with poor prognosis of colon cancer. The results showed that 17 genes were closely related to poor survival prognosis of colon cancer. Among them, there are 5 genes in the immune response, and the remaining 12 genes were also related to the tumor microenvironment. Analysis of 17 genes of cellular components showed that the genes of extracellular space were CCL2, TNFSF13B, LY96, CCL8, SELE, and SRGN, the genes of integral component membrane were MS4A4A, C3AR1, LAIR1, C1ORF162, IL18RAP, FCGR2B, TNFSF13B, LILRB3, CD52, and SELE, and the genes of plasma membrane types were C3AR1, LAIR1, IL18RAP, FCGR2B, TNFSF13B, LY96, SELE, and S100A12 (Table 1).
In this study, the genes we were interested in were CCL8, CCL2, FCGR2B, IL18RAP, and TNFSF13B. These genes are immune feedback function genes and belong to relatively core positions in the PPI network. Our review of the literature showed that CCL8 factor regulates colonic inflammation, and the inflammatory response is closely related to the immune microenvironment. Moreover, colitis is also linked to the worsening of colon cancer, and CCL8 is a target for immunotherapy in pancreatic cancer [19,29,30]. Related studies show that CCL2 is a tumor chemokine and a marker in the immune microenvironment of colon cancer [31]. IL18RAP factor plays an important regulatory role in colitis and Crohn’s disease, and can regulate interleukins IL-2, IL-7, and IL-15. These interleukins regulate the immune response and are associated with many factors, such as lymphocytes and macrophages [32]. Deepa Bedi et al. showed that TNFSF13B has s clinical significance in PD-L1 immunotherapy, but the specific mechanism needs further exploration. Importantly, these genes are significantly related to survival prognosis in colon carcinoma.
Colon cancer has been fully studied, especially in the area of correlation between gene expression and survival prognosis. Some of these experiments were completed in animal models, and some were performed in retrospective studies of patient data. However, research related to the tumor microenvironment needs larger and more comprehensive data to be thoroughly analyzed. With the development of genome sequencing technology, similar to the existence of TCGA database, we can better study and analyze the existing big data.
In summary, we downloaded the data of 191 patients from the TCGA database, analyzed and calculated the relevant scores through the ESTIMATE calculation method, and then gathered a list of genes related to the tumor microenvironment. These data have been independently verified in the colon cancer cohort. Some previously under-appreciated genes may play important regulatory roles in the tumor microenvironment. Finally, further research on these genes may lead to new understanding of colon cancer and the tumor microenvironment.
Conclusions
By using a series of bioinformatics tools and related algorithms, we screened out a group of genes that constitute the tumor microenvironment and affect the survival prognosis of gastric cancer patients. Among these genes, 17 genes with high expression reduce the survival time of gastric cancer patients, of which 5 genes are related to immune response function.
Figures
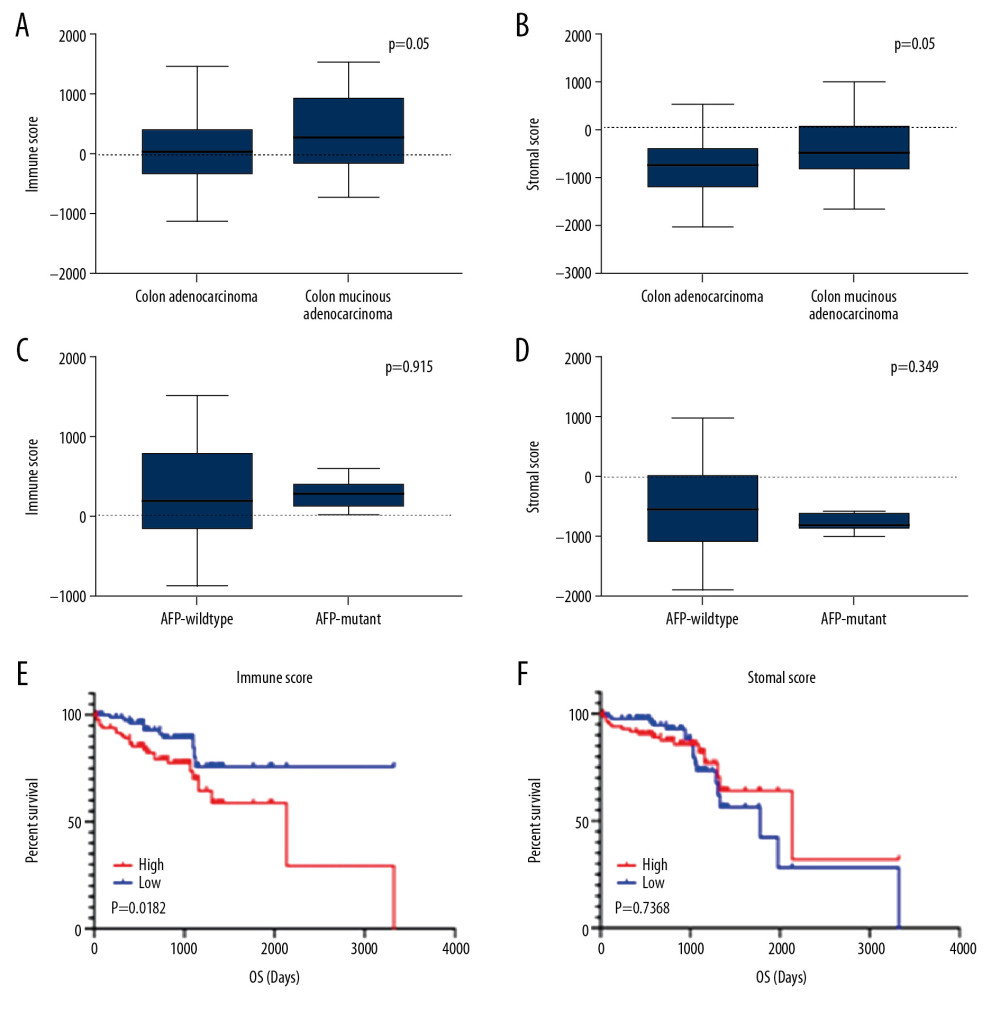 Figure 1. Correlation between immune score, stromal score, and survival rate of colon cancer. (A) Distribution of immune scores between Colon Adenocarcinoma and Colon Mucinous Adenocarcinoma. (B) Distribution of stromal scores between Colon Adenocarcinoma and Colon Mucinous Adenocarcinoma. (C) Distribution of immune scores between AFP-wildtype and AFP-mutant. (D) Distribution of stromal scores between AFP-wildtype and AFP-mutant. (E) Comparison of the survival difference between the high expression group and the low expression group for immune score, and the Kaplan-Meier survival curve. (F) Comparison of the stromal score in the high expression group and low expression group, the Kaplan-Meier survival curve, and comparing the survival difference between the 2 groups.
 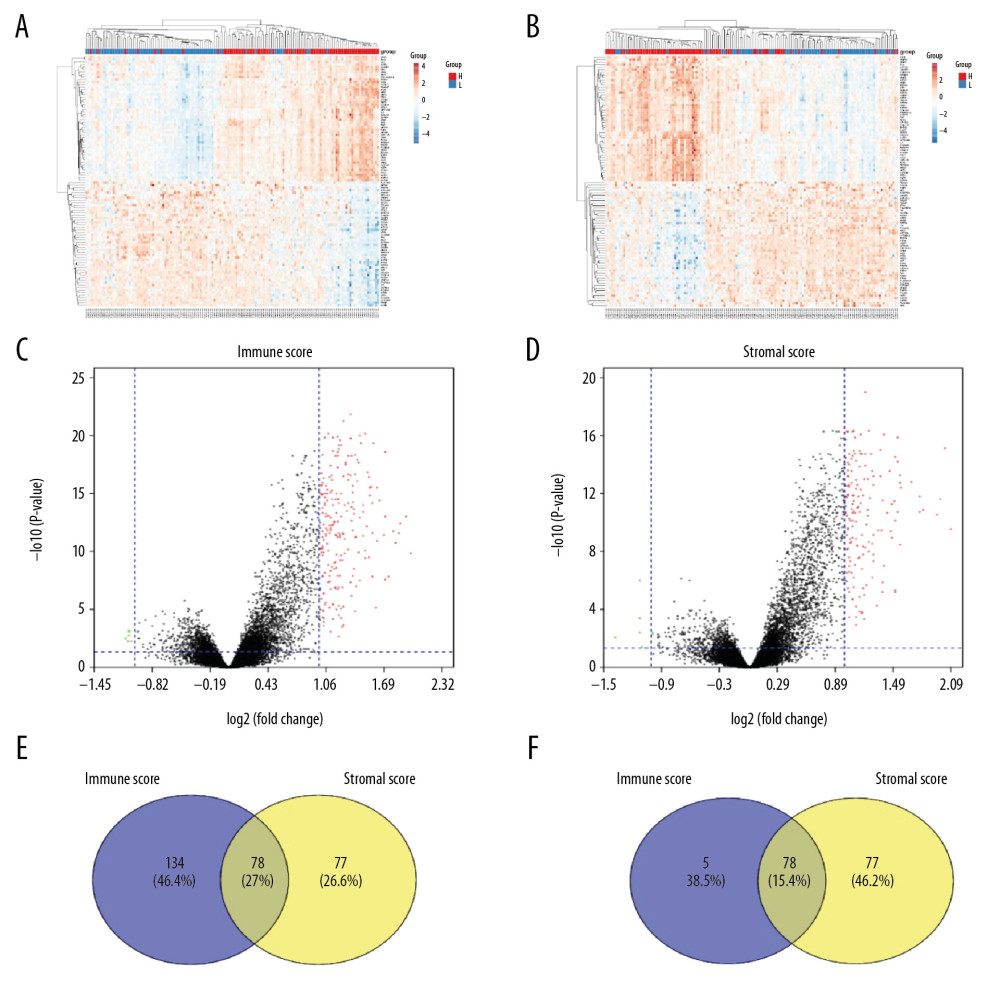 Figure 2. Comparison of COAD gene expression profile with immune score and stromal score. (A) Heat map of the immune score genes for the red part (high score group) and the blue part (low score group). (B) Heat map of the stromal score genes for the red part (high score group) and the blue part (low score group). (C) The volcano plot results show that the red dots are high expression data with an immune score of logFC ≥1.0, p<0.05; the green dots show low expression data with an immune score of logFC ≤1.0, p<0.05. (D) The volcano plot results show that the red dots are high expression data with a stromal score of logFC ≥1.0 and p<0.05; the green dots show low expression data with a stromal score of logFC ≤1.0 and p<0.05. The Venn diagram shows the number of genes that are usually upregulated (E) or downregulated (F) in the stromal and immune score groups.
 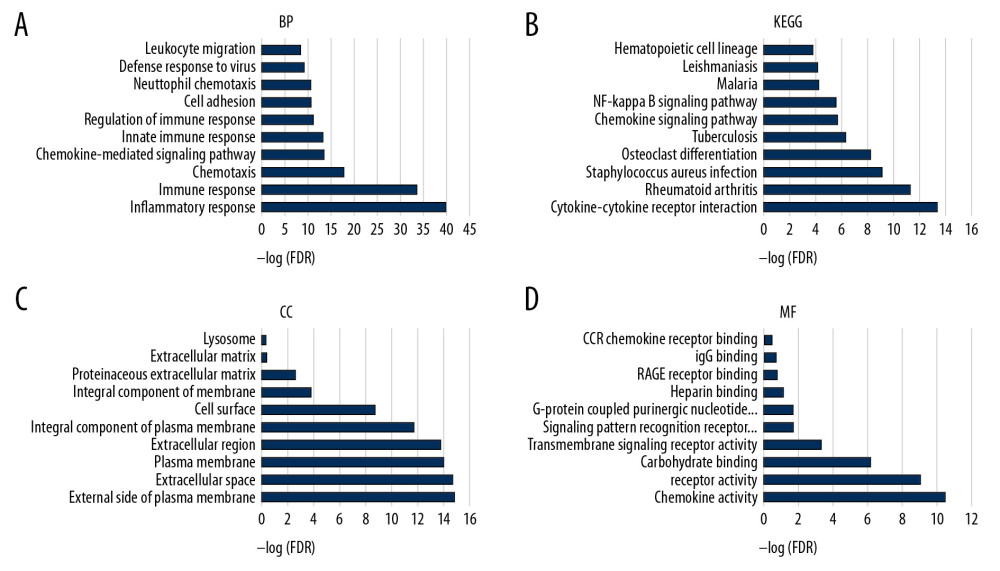 Figure 3. The functional enrichment analysis of DEGs was performed. The analysis results of TOP10 are shown in the picture. The false discovery rate (FDR) of GO analysis was obtained from the DAVID function annotation tool. (A) biological process analysis; (B) KEGG Pathway analysis; (C) cellular component analysis; (D) molecular function analysis.
 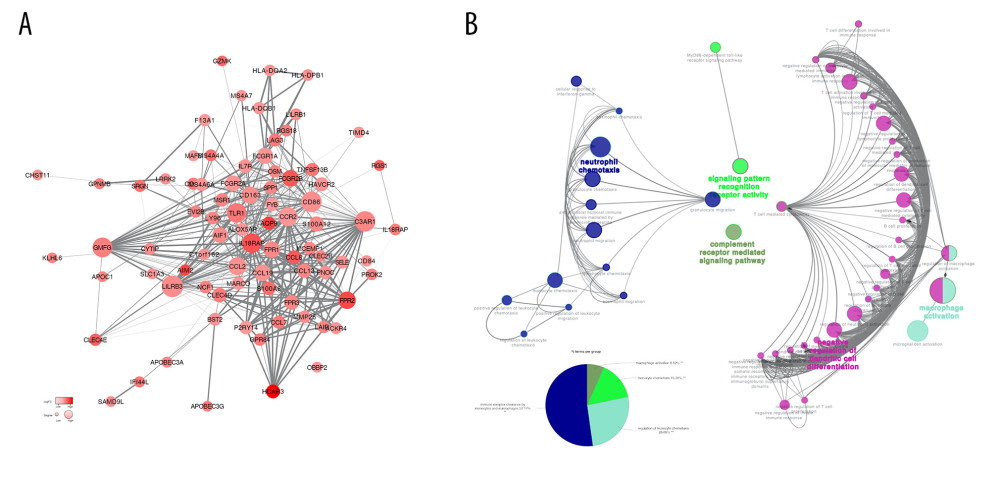 Figure 4. (A) Analysis of the interaction between genes by constructing a PPI network of DEGS. The thickness of the line represents the combined score, the color shade represents the LogFC value, and the circle size represents the degree value. (B) Immune system process analysis shows that immune complex clearance by monocytes and macrophages accounted for 52.17%, regulation of leukocyte chemotaxis accounted for 26.09%, monocyte chemotaxis accounted for 15.22%, and macrophage activation accounted for 6.52%.
 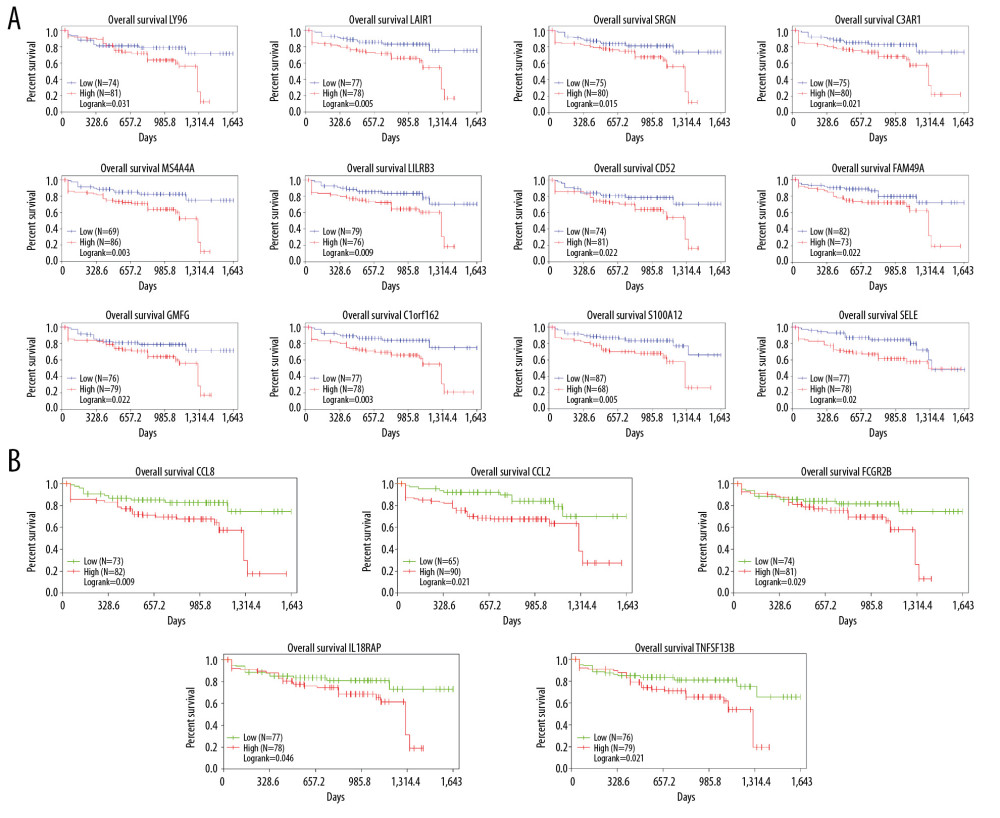 Figure 5. The results showed that among DEGs,17 genes had poor overall survival (log-rank <0.05). (A) 12 DEGs with markedly poor prognosis; (B) 5 of these genes belong to the immune response pathway.
 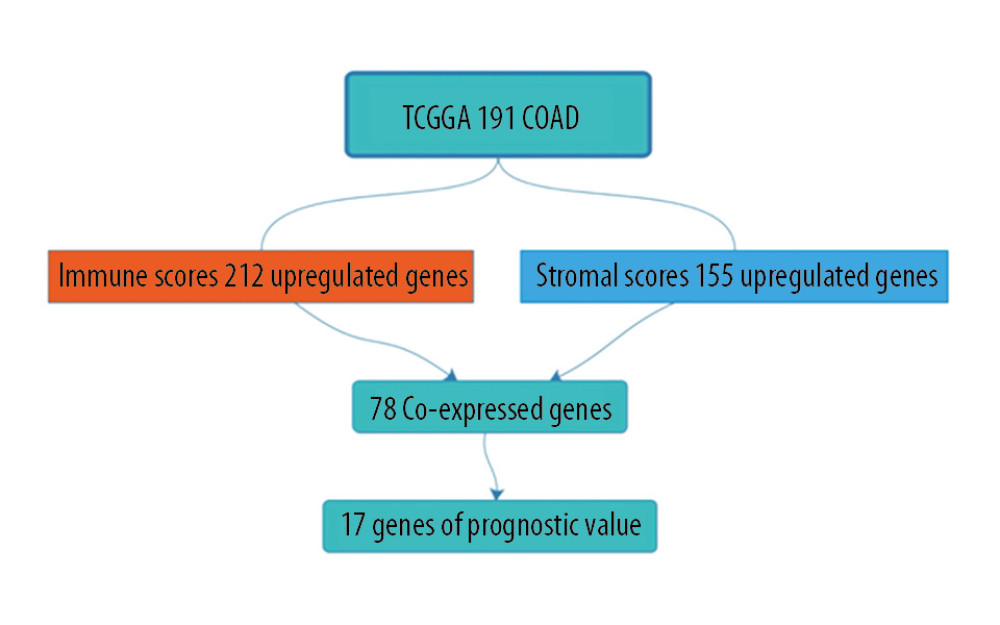 Figure 6. Work flow chart.
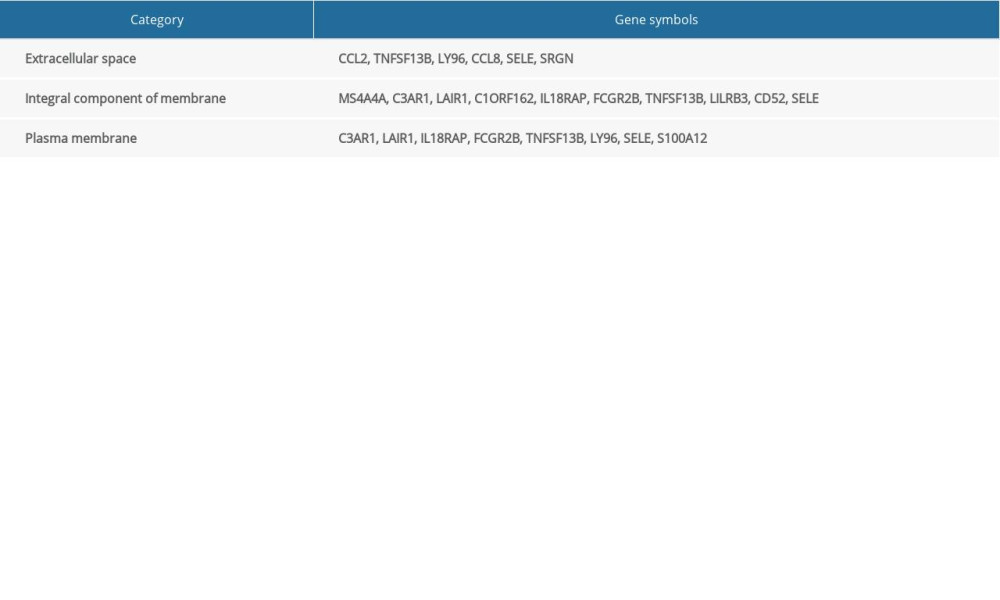
References
1. Bray F, Ferlay J, Soerjomataram I, Global cancer statistics 2018: GLOBOCAN estimates of incidence and mortality worldwide for 36 cancers in 185 countries: Cancer J Clin, 2018; 68(6); 394-424
2. Chen W, Sun K, Zheng R, Cancer incidence and mortality in China, 2014: Chin J Cancer Res, 2018; 30(1); 1-12
3. Dube PN, Sakle NS, Dhawale SA, Synthesis, biological investigation and docking study of novel chromen derivatives as anti-cancer agents: Anticancer Agents Med Chem, 2019; 19(9); 1150-60
4. Li L, Ma X, Study on specificity of colon carcinoma-associated serum markers and establishment of SVM prediction model: Saudi J Biol Sci, 2017; 24(3); 644-48
5. Jia D, Li S, Li D, Mining TCGA database for genes of prognostic value in glioblastoma microenvironment: Aging (Albany NY), 2018; 10(4); 592-605
6. Goldman M, Craft B, Hastie M, The UCSC Xena platform for public and private cancer genomics data visualization and interpretation: bioRxiv, 2019 326470
7. Chakraborty H, Hossain A, R package to estimate intracluster correlation coefficient with confidence interval for binary data: Comput Methods Programs Biomed, 2018; 155; 85-92
8. Wang J, Zhong J, Chen G, ClusterViz: A cytoscape APP for cluster analysis of biological network: IEEE/ACM Trans Comput Biol Bioinform, 2015; 12(4); 815-22
9. Otasek D, Morris JH, Boucas J, Cytoscape automation: Empowering workflow-based network analysis: Genome Biol, 2019; 20(1); 185
10. Szklarczyk D, Gable AL, Lyon D, STRING v11: Protein-protein association networks with increased coverage, supporting functional discovery in genome-wide experimental datasets: Nucleic Acids Res, 2019; 47(D1); D607-13
11. Mlecnik B, Galon J, Bindea G, Comprehensive functional analysis of large lists of genes and proteins: J Proteomics, 2018; 171; 2-10
12. Huang da W, Sherman BT, Lempicki RA, Systematic and integrative analysis of large gene lists using DAVID bioinformatics resources: Nat Protoc, 2009; 4(1); 44-57
13. Hur B, Kang D, Lee S, Venn-diaNet: Venn diagram based network propagation analysis framework for comparing multiple biological experiments: BMC Bioinformatics, 2019; 20(Suppl 23); 667
14. Maia J, Caja S, Strano Moraes MC, Exosome-based cell-cell communication in the tumor micro-environment: Front Cell Dev Biol, 2018; 6; 18
15. Berraondo P, Minute L, Ajona D, Innate immune mediators in cancer: Between defense and resistance: Immunol Rev, 2016; 274(1); 290-306
16. Palucka AK, Coussens LM, The basis of oncoimmunology: Cell, 2016; 164(6); 1233-47
17. Wu M-Y, Li C-J, Hou M-F, Chu P-Y, New insights into the role of inflammation in the pathogenesis of atherosclerosis: Int J Mol Sci, 2017; 18(10); 2034
18. Zhao S-C, Ma L-S, Chu Z-H, Regulation of microglial activation in stroke: Acta Pharmacol Sin, 2017; 38(4); 445-58
19. Banerjee K, Kumar S, Ross KA, Emerging trends in the immunotherapy of pancreatic cancer: Cancer Lett, 2018; 417; 35-46
20. Comen EA, Bowman RL, Kleppe M, Underlying causes and therapeutic targeting of the inflammatory tumor microenvironment: Front Cell Dev Biol, 2018; 6; 56
21. Darvin P, Toor SM, Sasidharan Nair V, Elkord E, Immune checkpoint inhibitors: Recent progress and potential biomarkers: Exp Mol Med, 2018; 50(12); 165
22. Echizen K, Oshima H, Nakayama M, Oshima M, The inflammatory microenvironment that promotes gastrointestinal cancer development and invasion: Adv Biol Regul, 2018; 68; 39-45
23. Sadighi Akha AA, Aging and the immune system: An overview: J Immunol Methods, 2018; 463; 21-26
24. Aramburu J, López-Rodríguez C, Regulation of inflammatory functions of macrophages and T lymphocytes by NFAT5: Front Immunol, 2019; 10; 535
25. De Almeida CV, de Camargo MR, Russo E, Amedei A, Role of diet and gut microbiota on colorectal cancer immunomodulation: World J Gastroenterol, 2019; 25(2); 151-62
26. Galon J, Bruni D, Approaches to treat immune hot, altered and cold tumours with combination immunotherapies: Nat Rev Drug Discov, 2019; 18(3); 197-218
27. Grambergs R, Mondal K, Mandal N, Inflammatory ocular diseases and sphingolipid signaling: Adv Exp Med Biol, 2019; 1159; 139-52
28. Kazanietz MG, Durando M, Cooke M, CXCL13 and its receptor CXCR5 in cancer: Inflammation, immune response, and beyond: Front Endocrinol (Lausanne), 2019; 10; 471
29. Lu Y, Jiang B-C, Cao D-L, Chemokine CCL8 and its receptor CCR5 in the spinal cord are involved in visceral pain induced by experimental colitis in mice: Brain Res Bull, 2017; 135; 170-78
30. Jones G-R, Bain CC, Fenton TM, Dynamics of colon monocyte and macrophage activation during colitis: Front Immunol, 2018; 9; 2764
31. Hartwig T, Montinaro A, von Karstedt S, The TRAIL-induced cancer secretome promotes a tumor-supportive immune microenvironment via CCR2: Mol Cell, 2017; 65(4); 730-42.e5
32. Fan MY, Low JS, Tanimine N, Differential roles of IL-2 signaling in developing versus mature tregs: Cell Rep, 2018; 25(5); 1204-13.e4
Figures
Figure 1. Correlation between immune score, stromal score, and survival rate of colon cancer. (A) Distribution of immune scores between Colon Adenocarcinoma and Colon Mucinous Adenocarcinoma. (B) Distribution of stromal scores between Colon Adenocarcinoma and Colon Mucinous Adenocarcinoma. (C) Distribution of immune scores between AFP-wildtype and AFP-mutant. (D) Distribution of stromal scores between AFP-wildtype and AFP-mutant. (E) Comparison of the survival difference between the high expression group and the low expression group for immune score, and the Kaplan-Meier survival curve. (F) Comparison of the stromal score in the high expression group and low expression group, the Kaplan-Meier survival curve, and comparing the survival difference between the 2 groups.Figure 2. Comparison of COAD gene expression profile with immune score and stromal score. (A) Heat map of the immune score genes for the red part (high score group) and the blue part (low score group). (B) Heat map of the stromal score genes for the red part (high score group) and the blue part (low score group). (C) The volcano plot results show that the red dots are high expression data with an immune score of logFC ≥1.0, p<0.05; the green dots show low expression data with an immune score of logFC ≤1.0, p<0.05. (D) The volcano plot results show that the red dots are high expression data with a stromal score of logFC ≥1.0 and p<0.05; the green dots show low expression data with a stromal score of logFC ≤1.0 and p<0.05. The Venn diagram shows the number of genes that are usually upregulated (E) or downregulated (F) in the stromal and immune score groups.Figure 3. The functional enrichment analysis of DEGs was performed. The analysis results of TOP10 are shown in the picture. The false discovery rate (FDR) of GO analysis was obtained from the DAVID function annotation tool. (A) biological process analysis; (B) KEGG Pathway analysis; (C) cellular component analysis; (D) molecular function analysis.Figure 4. (A) Analysis of the interaction between genes by constructing a PPI network of DEGS. The thickness of the line represents the combined score, the color shade represents the LogFC value, and the circle size represents the degree value. (B) Immune system process analysis shows that immune complex clearance by monocytes and macrophages accounted for 52.17%, regulation of leukocyte chemotaxis accounted for 26.09%, monocyte chemotaxis accounted for 15.22%, and macrophage activation accounted for 6.52%.Figure 5. The results showed that among DEGs,17 genes had poor overall survival (log-rank <0.05). (A) 12 DEGs with markedly poor prognosis; (B) 5 of these genes belong to the immune response pathway.Figure 6. Work flow chart. In Press
05 Mar 2024 : Clinical Research
Role of Critical Shoulder Angle in Degenerative Type Rotator Cuff Tears: A Turkish Cohort StudyMed Sci Monit In Press; DOI: 10.12659/MSM.943703
06 Mar 2024 : Clinical Research
Comparison of Outcomes between Single-Level and Double-Level Corpectomy in Thoracolumbar Reconstruction: A ...Med Sci Monit In Press; DOI: 10.12659/MSM.943797
21 Mar 2024 : Meta-Analysis
Economic Evaluation of COVID-19 Screening Tests and Surveillance Strategies in Low-Income, Middle-Income, a...Med Sci Monit In Press; DOI: 10.12659/MSM.943863
10 Apr 2024 : Clinical Research
Predicting Acute Cardiovascular Complications in COVID-19: Insights from a Specialized Cardiac Referral Dep...Med Sci Monit In Press; DOI: 10.12659/MSM.942612
Most Viewed Current Articles
17 Jan 2024 : Review article
Vaccination Guidelines for Pregnant Women: Addressing COVID-19 and the Omicron VariantDOI :10.12659/MSM.942799
Med Sci Monit 2024; 30:e942799
14 Dec 2022 : Clinical Research
Prevalence and Variability of Allergen-Specific Immunoglobulin E in Patients with Elevated Tryptase LevelsDOI :10.12659/MSM.937990
Med Sci Monit 2022; 28:e937990
16 May 2023 : Clinical Research
Electrophysiological Testing for an Auditory Processing Disorder and Reading Performance in 54 School Stude...DOI :10.12659/MSM.940387
Med Sci Monit 2023; 29:e940387
01 Jan 2022 : Editorial
Editorial: Current Status of Oral Antiviral Drug Treatments for SARS-CoV-2 Infection in Non-Hospitalized Pa...DOI :10.12659/MSM.935952
Med Sci Monit 2022; 28:e935952