21 November 2020: Database Analysis
Comprehensive Analysis of Alternative Splicing Signature in Gastric Cancer Prognosis Based on The Cancer Genome Atlas (TCGA) and SpliceSeq Databases
Xiaohu Cheng1ACEG, Xianghua Li2ACE, Yimei Gu3AE, Lianbang Zhou1AE, Jingjing Tang1B, Xiang Dai1B, Heng Jiang1B, Yang Huang1B, Yingfeng Zhang1B, Tongtong Xu1B, Zhining Liu1AE*, Qihong Zhao4AEDOI: 10.12659/MSM.925772
Med Sci Monit 2020; 26:e925772


Abstract
BACKGROUND: Increasing evidence suggests that the alternative splicing (AS) signature plays a role in the carcinogenesis and prognosis of various cancers. However, the prognostic role of AS in gastric cancer is not clear and needs to be clarified.
MATERIAL AND METHODS: To identify the differentially expressed AS (DEAS) events, we performed a differential expression analysis between normal and tumor tissue. The DEAS event was further applied to construct a prognostic signature by performing univariate Cox regression analysis and least absolute shrinkage and selection operator (LASSO) analysis. The Kaplan-Meier curve analysis and receiver operating characteristic curve (ROC) analysis were used to evaluate the prognostic value of the AS signature. In addition, the network of the splicing events with splicing factors was constructed using the Cytoscape software.
RESULTS: A total of 30 005 alternative splicing (AS) events with 372 patients were retrieved from the SpliceSeq database and TCGA database. By performing differential expression analysis, a total of 419 alternative splicing events were screened out, including 56 upregulated and 363 downregulated. We further constructed an AS-related prognostic signature by conducting a series bioinformatics analyses. Moreover, we identified that the AS signature could serve as an independent predictor for the prognosis of GC. We also found that AS signature had a more robust and precise efficacy for prognostic prediction in GC patients. Interestingly, the areas under 3- and 5-year survival curves are similar, both of which are greater than 1-year survival curve, suggesting that the long-term predictive accuracy of our prognostic model built upon AS signature is superior.
CONCLUSIONS: We performed a comprehensive analysis of overall prognostic-associated AS events concerning GC and constructed a prognostic model to predict the long-term prognostic survival outcomes in GC patients. We also developed a network of splicing events with splicing factors to reveal new potential molecular diagnostic biomarkers and therapeutic targets for GC patients.
Keywords: Alternative Splicing, Gemfibrozil, Genetic Association Studies, Cohort Studies, Databases, Genetic, Gene Expression Profiling, Gene Regulatory Networks, Genome, Human, Proportional Hazards Models, RNA, Messenger, ROC Curve
Background
Gastric cancer (GC) is an aggressive malignancy with the second-highest mortality and an increasing incidence rate among all malignancies worldwide [1]. Although gastric cancer has become a high-incidence malignancy seen in clinical practice, its pathogenic mechanism is not fully defined. The synergistic effect of environmental factors and genetic factors is the main cause of the tumorigenesis and development of gastric cancer [2]. We found that the occurrence and development of gastric cancer is often accompanied by abnormal changes in the structure and expression level of a variety of tumor-related genes, accompanied by the emergence of multiple abnormal splicing variants [3,4]. Many studies have shown that the splicing regulation of eukaryotic genes is as a key element in the tumorigenesis and development of gastric cancer, and has become the focus point of research into the pathogenesis of gastric cancer [5,6].
Alternative splicing (AS) is a bioprocess by which RNA exons produced by transcription of major genes or mRNA precursors are reconnected by RNA splicing in a variety of ways. In the early 1980s, alternative splicing was found in the gene encoding process of calcitonin in mammals [7], as well as immunoglobulin [8]. Since then, more and more studies have confirmed that alternative splicing exists widely in eukaryotes. In mammals, alternative splicing is closely related to mRNA processing, which is one of the reasons for the increasing complexity of mRNA and diversity of proteins [9]. The latest mRNA sequencing technology and expression sequence tagging technology showed that alternative splicing exists in about 95% of human genes [10,11], especially in genes involved in cancer-related cell migration, cell growth regulation, hormonal response, cell death, and chemotherapy response. At present, the mechanism underlying splicing defects in cancer is still unclear. Some previous studies found that genetic and somatic mutations in cis-acting elements, as well as variations in the composition, concentration, location, and activity of trans regulatory factors, all affect the recognition and function of splicing sites, leading to cancelation [12–14]. The correlation between alternative splicing and tumorigenesis, development, or metastasis in various malignancies has been reported. Alternative splicing is a promising biomarker for cancer screening, clinical decision-making, and prognosis prediction [15,16].
Currently, the prognostic value of GC has been not fully studied and there is insufficient knowledge of the prognostic role of AS in GC. Thus, in this study, we provide a systematic description of survival-associated AS events related to GC, and also explore the potential mechanism by which splicing signatures influence the biological process of GC. We also established a robust predictive model on the basis of AS events from The Cancer Genome Atlas (TCGA) database. GSEA analysis was performed to explore the potential mechanism in the AS signature in GC. This prediction model might assist oncologists with clinical medication decision-making and prediction of prognosis for gastric cancer patients.
Material and Methods
DATA ACCESS AND HANDLING OF AS EVENTS:
RNA sequencing data (third level) (TCGA-STAD) were obtained from the TCGA database website (https://bioinformatics.mdanderson.org/TCGASpliceSeq/), as well as the corresponding clinical information including age, sex, grade, stage, T, N, and M. To calculate the AS profile for each GC patient, SpliceSeq (Java software) was used to quantify the inclusion level of splicing events through calculating the percent spliced-in index (PSI) value, and we explored the aberrant AS pattern of each exon and splice sample in the GC dataset including 7 types (AA, as alternate acceptor site; AT, as alternate terminator; ES, as exon skip; AD, as alternate donor site; AP, as alternate promoter; ME, as mutually exclusive exons; RI, as retained intron) [17–19]. Samples with an inclusion criterion of PSI value no less than 0.75 were applied to generate the dataset of alternative splicing signatures. An analysis of Differential Expressions of Genes was applied using limma R package with stringent filters that the absolute value of log2FC greater than 1 and the false discovery rate (FDR) value less than 0.05 for the accuracy of our AS events dataset [20]. In our study, 372 patients were included after combining the clinical information (only retaining the information of tumor samples for the subsequent survival analysis) and alternative splicing events. The expression heatmap of differentially expressed alternative splicing events (EAS) was constructed to describe OS-SEs in details. Volcano plots of the distribution of EAS in the GC dataset were applied to illustrate the upregulated and downregulated alternative splicing events.
ESTABLISHMENT OF GC PROGNOSTIC MODEL BASED ON ASES:
Univariate Cox regression analysis was applied to identify prognosis-related alternative splicing events and evaluate the prognostic value of each filtered alternative splicing event along with clinical data using a threshold of a P value <0.05 [21]. To further avoid result overfitting, we then selected the statistically significant overall survival-related splicing events to perform a LASSO regression analysis, 10 of which were evaluated with the β value, which means the regression coefficient for specific paired overall survival was related to splicing events in our study cohort. Using the correlation coefficient obtained from LASSO regression analysis, we further constructed the prognosis model. Risk scores were evaluated built upon the following formula with the β value from the LASSO regression analysis:
In accordance with the formula above, OS-SEs data were separated into 2 subgroups: a high-risk subgroup and a low-risk subgroup. In addition, the area under the time-dependent receiver operating characteristic (ROC) curve was used to measure the predictive power of the model [22]. In addition, we also evaluate the independence of the signature and clinicopathological characteristics, including age, sex, TNM stage, pathologic type, and clinical stage by performing univariate and multivariate Cox regression analyses [23].
CONSTRUCTION OF A SPLICING REGULATORY NETWORK:
Splicing factors (SFs) could combine with pre-mRNAs and affect the process of alternative splicing of exons, especially for the determination of splicing site, which suggested the overall survival-related splicing events were underlyingly regulated with certain splicing factors [24,25]. First of all, over 100 splicing factors that corresponded with gene expression data were retrieved in the TCGA database [26]. Spearman correlation analysis was applied with the following threshold value: the correlation coefficient >0.3 and the P value <0.05. The splicing regulatory network was constructed using Cytoscape software [27].
GENE SET ENRICHMENT ANALYSIS:
To explore the potential pathways involved in the tumorigenesis and progression of malignancies in GC, we performed gene set enrichment analysis (GSEA) for the A signature between the high-risk group and low-risk group. The “C2: Canonical pathways” gene database access from MSigDB (the Molecular Signatures Database) served as the reference gene set [28]. The essential pathway with the filter of P less than 0.05 and FDR less than 0.25 after accomplishing 1000 permutations were significantly enriched.
Results
OVERVIEW OF ASES AND OS-SES IN GC:
The process in Figure 1 illustrates the workflow and the novel findings of this study. The ASEs and clinical information of GC were retrieved from the SpliceSeq database and TCGA database, respectively. To improve the accuracy of the results, we filtered out the alternative splicing events with the cut percentage (PSI) value less than 0.75 in the gene, and finally got 30 005 splicing events in total (Figure 2A). The Upset plot described alternative splicing events in different patterns, including alternate acceptor site (AA), alternate terminator (AT), alternate promoter (AP), alternate donor site (AD), retained intron (RI), exon skip (ES), and mutually exclusive exons (ME). We detected 30 005 ASEs within 10 559 genes, including 3441 AA events in 2615 genes, 3826 AP events in 3826 genes, 2776 AD events in 2211 genes, 3626 AT events in 3626 genes, 13 489 ES events in 6805 genes, 67 ME events in 67 genes, and 2780 RI events in 1952 genes. It is noteworthy that each gene might possibly undergo more than 4 splicing patterns. Among the 7 different types of splicing patterns, ES event was the overriding type because it occupied nearly 45.0% of ASEs, and may have the greatest potential in transcriptome diversity and altering protein species in GC.
IDENTIFICATION OF OVERALL SURVIVAL-ASSOCIATED EVENTS (OS-SES):
For these alternative splicing events, an analysis of differential expressions of genes was applied using the limma R package with stringent filters: the absolute value of logFC greater than 1 and the false discovery rate (FDR) value <0.05. As a result, 419 alternative splicing events were filtered out, including 56 upregulated alternative splicing events and 363 downregulated ones. The differentially expressed alternative splicing events (DEAS) are shown using a heatmap and are indicated as being upregulated or downregulated. DEAS is exhibited as a volcano plot in the GC dataset (Figure 2B, 2C). Then, we performed the survival analysis of these alternative splicing events to identify the potential ASEs associated with the survival of GC. Firstly, we downloaded the corresponding clinical information related to gastric cancer from TCGA database. By combining the clinical information (only retaining tumor samples for subsequent survival analysis) and alternative splicing events, we finally got a dataset containing 372 patients’ alternative splicing events, survival time, and survival state. A univariate Cox regression analysis was applied for identification of OS-AS events and evaluation of the predicting value for all the included alternative splicing event along with clinical data using a threshold of P value <0.05. We enrolled 17 statistically significant overall survival-associated AS events (OS-SEs) and display them in forest plots (Figure 3), 8 of which had an adverse influence on the survival probability for GC patients, including TMEM151B, TBC1D1, RTN1, ITGB4, FAM73B, CLSTN1, CAMKK2, and CAMK2G, whereas the other 9 were negatively associated with the prognosis of gastric cancer.
DEVELOPMENT AND EVALUATION OF THE PROGNOSTIC MODEL BASED ON AS:
To avoid overfitting, we further applied the LASSO regression analysis for these 17 alternative splicing events. Statistically significant alternative splicing events were evaluated with β value, which indicates the regression coefficient for specific paired overall survival-related splicing events in the study cohort (Figure 4A, 4B). To further calculate the risk score for each GC patient, we developed an AS-related risk formula according to their regression coefficient:
According to the risk formula, the C-index was calculated, and reached 0.649066.
In accordance with the formula mentioned above, OS-SEs data were separated into a high-risk group and a low-risk group based on the median risk score. In addition, the area under time-dependent receiver operating characteristic (ROC) curve was applied to measure the predictive power of the model mentioned above. The survival analysis showed that there was a significant difference between the high-risk group and low-risk group (Figure 4C). The mortality rate in the high-risk group were obviously higher than in the low-risk subgroups (Figures 5A, 5B). The heatmap illustrates the expression data of survival-related alternative splicing events analyzed by LASSO regression (Figure 5C).
Furthermore, ROC curves estimated from 1-year, 3-year, and 5-year survival were applied to evaluate the accuracy of the OS-AS model. By analyzing the AUC values of 1 year, 3 years, and 5 years, we found that the accuracy of the model was relatively high for AUCs keeping above 0.65 over time, and our prognosis model was the best in 5-year ROC evaluation, as clearly shown in Figure 6A. Meanwhile, the AUC area of risk scores was significantly higher than that of other clinicopathological characteristics (Figure 6B). In addition, to illustrate the independent predicting value of our model, we associated the model with available clinicopathological characteristics including age, sex, grade, and TNM stage, and found that our model could be used as an independent predictor with univariate (Figure 6C) and multivariate (Figure 6D) Cox regression analysis. These results suggest that our model based on alternative splicing events can precisely identify the prognosis of patients with GC, irrespective of other clinicopathological characteristics. Moreover, as presented in Figure 7, the overall prognostic alternative splicing events showed a more prominent and precise prognostic efficacy than any other certain alternative splicing pattern because the AUCs stayed above 0.7, which further proved the reliability of our prognosis model.
ESTABLISHMENT OF SPLICING REGULATORY NETWORK:
Splicing factors (SFs) can regulate alternative splicing events through binding to pre-mRNAs and influence exon selection and splicing site determination. Therefore, we constructed a network of prognostic alternative splicing events associated with splicing factors. Firstly, we extracted over 100 splicing factors corresponding with gene expression data in the TCGA database, and then combined them with the prognostic splicing events. After correlation analysis, we screened 179 significant pairs with the threshold value of the correlation coefficient greater than 0.3 and the P value less than 0.05. The splicing regulatory network was constructed with Cytoscape software (Figure 8). All 10 splicing events mentioned above were entered into survival analysis. Five of these 10 SFs had positive effects on the prognosis of patients with GC, including NUDT16L1, APOLD1, SCOC, ITGA7, and ASCC1, while the other 5 were corresponded with poor prognosis (Figure 9). Interestingly, the survival probability of ITGA7 >0.15 suddenly dropped to zero due to the missing follow-up data.
GENE SET ENRICHMENT ANALYSIS:
To elucidate the underlying mechanism for related pathways, all significant genes included in our study cohort were entered into gene set enrichment analysis for the prognostic alternative splicing event with gene data access from “C2: Canonical pathways” in the MSigDB database. Results demonstrated that possible mechanisms include “autophagy”, “cellular response to DNA damage stimulus”, “DNA repair”, “regulation of cell morphogenesis”, and “response to hypoxia” were enriched in the AS prognostic signature (Figure 10).
Discussion
In 1978, Gilbert [29] discovered and proposed the phenomenon of alternative splicing in a study of the adenovirus exon gene. Cancer is a complex disease related to many gene mutations and epigenetic variations. In the process of transforming normal cells into tumor cells, the defining features of tumor cells, such as unlimited replication and continuous proliferation ability, the ability of invasion and metastasis, and escaping from immune attack, are closely related to abnormal alternative splicing [30].
Alternative splicing serves as a key factor in the bioprocess of gastric cancer. For example, researchers have found ING4 to be downregulated in GC, gliomas, breast tumors, and head and neck squamous cell carcinomas [32]. Abnormal splicing of ING4 can further gene expression in gastric adenocarcinoma and plays a role in regulation of cell growth and motility [31,32]. Meanwhile, some studies have shown that alternative splicing could serve as diagnostic and prognostic biomarkers [33,34]. Genomic analysis showed the upregulation of spliced-KAI1 derived from the alternative splicing of exon 7 in metastatic tissues of gastric cancer patients. Further molecular experiments showed that there were functional differences between the wild-type KAI1 and the spliced-KAI1 in cell motility, tumorigenesis, and development. The spliced-KAI1 might be a diagnostic marker for patients with poor prognosis [35,36]. In addition, alternative splicing is also related to the escape mechanism of immune surveillance of tumor cells [37].
Because of the development of the high-throughput sequencing technology, the potential significance of AS profiling has been proved with more and more solid evidence in gastric cancer. For example, activation of ITGA7, which is a stem cell marker in esophageal squamous cell carcinoma [38], has been proved to promote colorectal cancer metastasis [39]. In our study, patients with the upregulation of ITGA7 had higher risk of poor prognosis and shorter survival time.
The development of GC is regulated by complicated factors. Our study provides an overall picture of AS signatures in GC, while previous studies only provided a glimpse of AS in GC. To the best of our knowledge, the present study is the first to provide a comprehensive understanding and identification for OS-AS events in gastric cancer. The overall expression of alternative splicing event presented a low expression level in tissue. Some splicing events showed tissue-specific expression and a high expression level (Figure 3). As a result, 30 005 alternative splicing events were retrieved and 419 alternative splicing events were filtered out, including 56 upregulated and 363 downregulated, using the limma R package in GC. We also compared the AS signatures with available clinicopathological characteristics, including age, sex, grade, and TNM stage, and found that AS signatures, as independent predictors, had a clear and statistically significant predicative performance for AUCs maintaining >0.7. To generate a more precise and efficient prognostic model for gastric cancer, we integrated multiple clinicopathological characteristics as well as different biomarkers instead of using intuitive clinical indicators alone. Therefore, we compared overall AS signatures to any other certain pattern of AS and found that overall AS signatures achieved the most apparent and precise performance to predict the outcomes in GC patients in both the high- and low-risk groups. Interestingly, the areas under 3- and 5-year survival curves were similar, and both were greater than the 1-year survival curve, suggesting that using our prognostic model built upon the AS signature to predict future prognostic outcomes much better.
The gene set enrichment analysis also displayed some underlying mechanisms, such as cellular response to DNA damage stimulus, DNA repair, regulation of cell morphogenesis, and response to hypoxia, supporting the predictive utility of our prognostic model. Although much progress had been made in defining prognostic factors in GC in the last decade, the actual gene regulation and gene markers of gastric cancer remain unclear. THE present study may provide a new perspective in on regulating genes in the progression of gastric cancer.
With the development of technology, it has been recognized that alternative splicing serves a key role in the tumorigenesis of GC. Exploring the pattern of alternative splicing in the occurrence of gastric cancer is expected to provide an important biomarker for the occurrence and diagnosis of gastric cancer. Although we are still in the first stage of understanding all gastric cancer-related alternative splicing, growing progress in this area promotes the study of gastric cancer and other cancers.
Although greats effort has been made to explore the prognostic value of GC, several limitations of our study need to be considered. Firstly, we lacked an external dataset to further validate our result; therefore, further studies are needed to validate our conclusions. Secondly, the mechanisms of action of AS in GC need
Conclusions
We performed a comprehensive analysis of overall prognostic-associated AS events in GC and constructed a prognostic model to convincingly predict the long-term survival outcomes in GC patients, irrespective of other clinicopathological characteristics. We also developed a network of splicing events with splicing factors to reveal new potential molecular diagnostic biomarkers and therapeutic targets for GC patients.
Figures
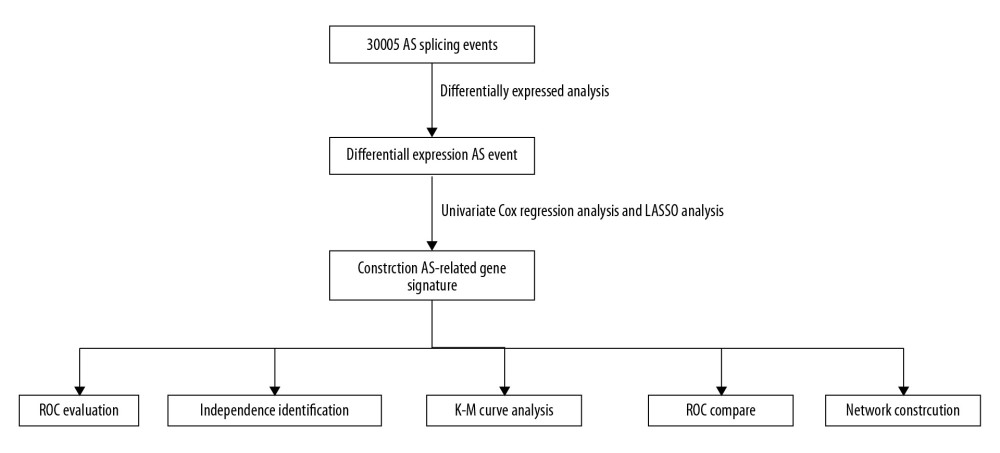 Figure 1. The flowchart to illustrate the workflow and the novel findings of this study.
 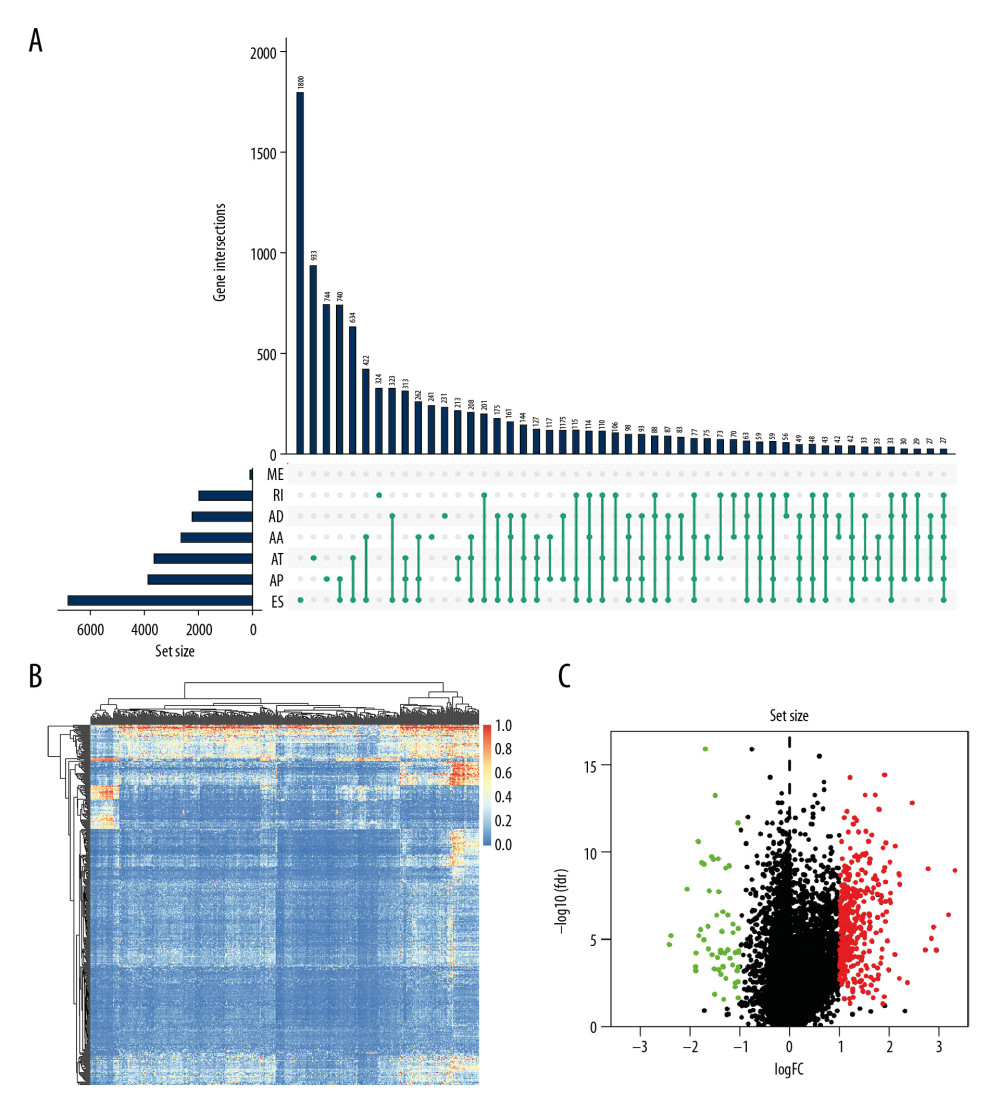 Figure 2. The landscape of aberrant alternative splicing events in GC cohort. (A) Upset plot of ASEs for the 7 different patterns, including AA as alternate acceptor site, AT as alternate terminator, ES as exon skip, AD as alternate donor site, AP as alternate promoter, ME as mutually exclusive exons, and RI as retained intron in the GC. (B) The expression heatmap of differentially expressed alternative splicing events (DEAS). (C) Volcano plots of the distribution of DEAS in the GC dataset. Red dots represent upregulated alternative splicing events whereas green dots represent downregulated ones.
 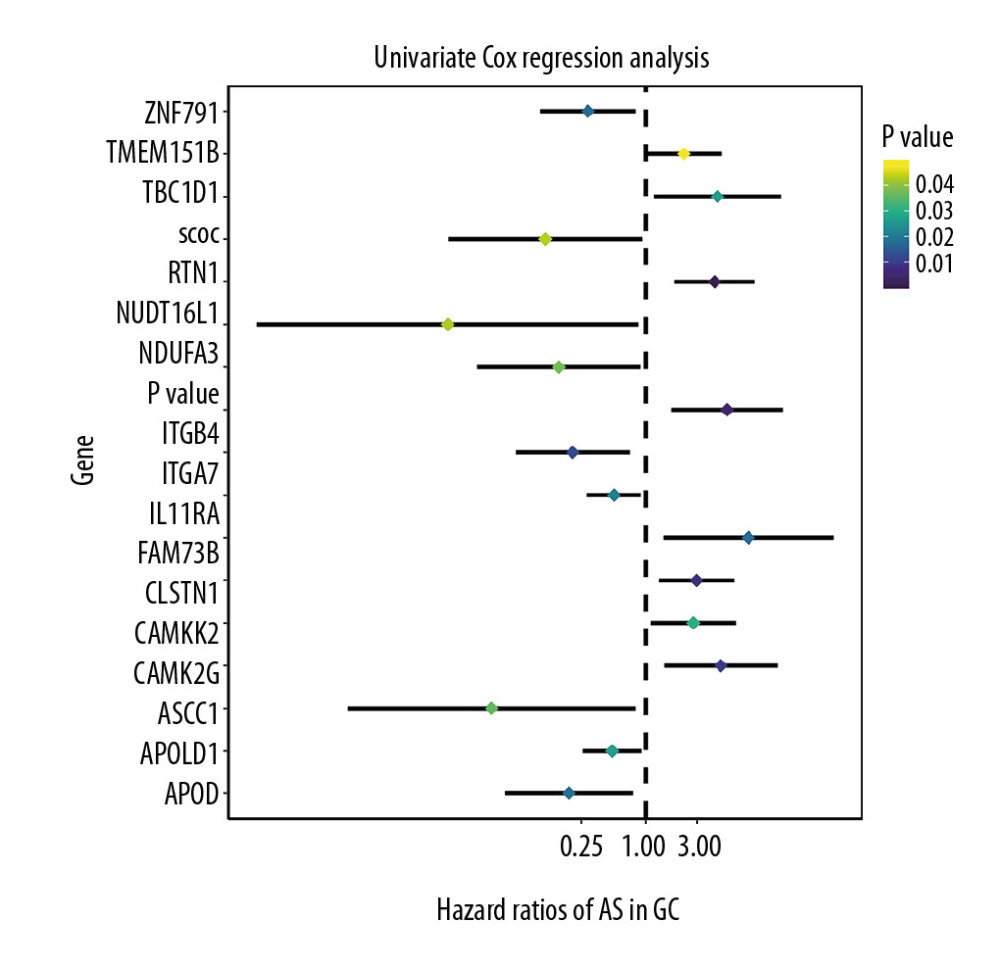 Figure 3. Forest plots for univariate Cox analysis of the survival associated AS events in GC cohort with hazard ratios and 95% confidence intervals. The color scale beside indicates the P values.
 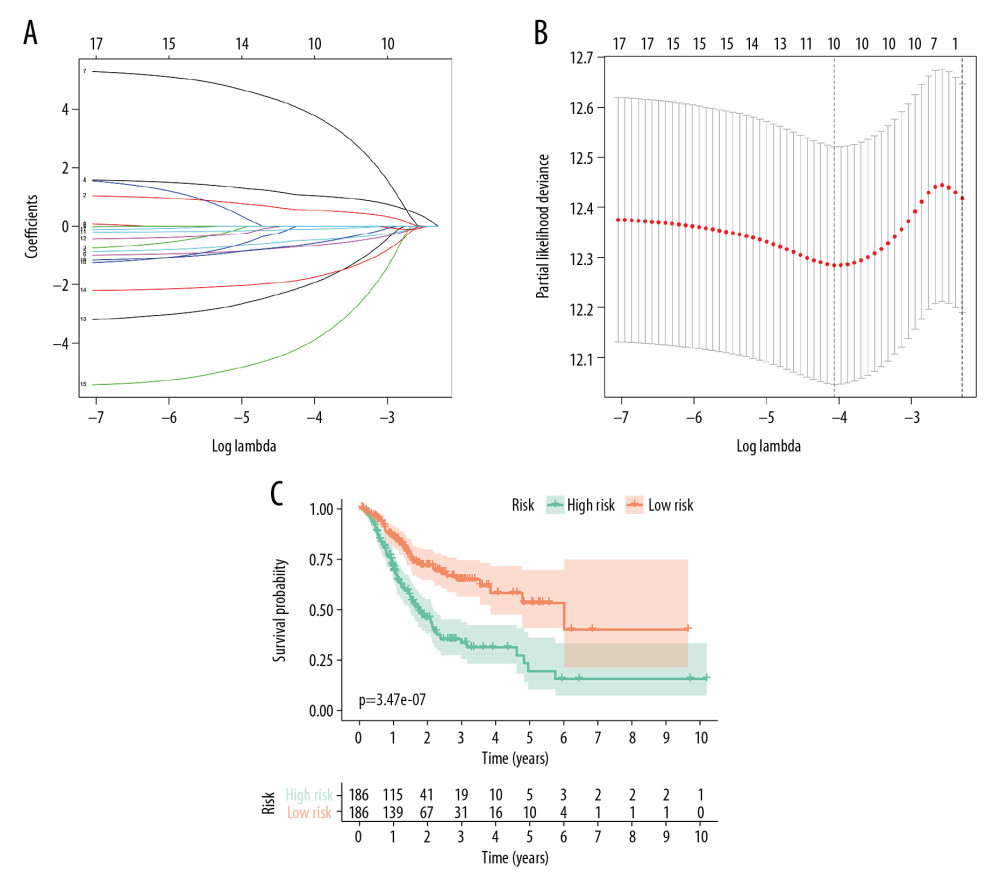 Figure 4. Identification of prognostic model based on the AS events in GC. (A) Evaluation of OS-SEs with the coefficients calculated in the LASSO regression. (B) Plots of the cross-validation error rates. The dashes signify the value of the minimal error and greater λ value. (C) Survival curve of prognostic model in patients with GC for 2 groups (high-risk group vs. low-risk group) based on median-cut of risk score calculated by evaluation of OS-SEs with the coefficients calculated in LASSO regression.
 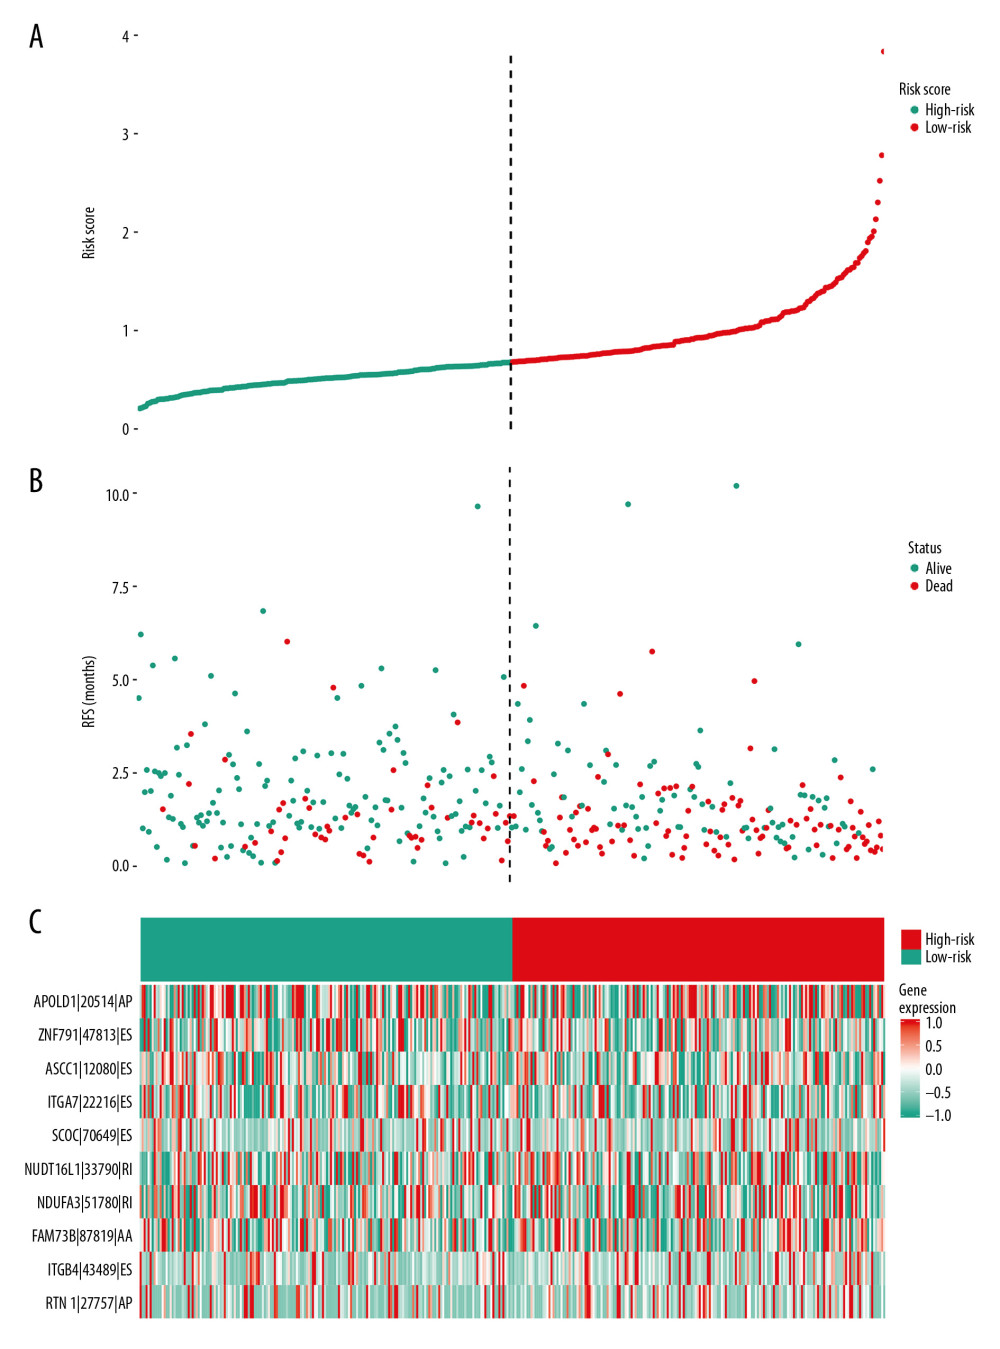 Figure 5. mRNA signature risk score distribution, heatmap of the mRNA expression profiles. Rows represent mRNAs, and columns represent patients. (A) The risk score curve, red dots show high-risk samples and while green dots show low-risk samples. (B) Distribution of patients’ survival status and overall survival (OS) times classified with risk scores, red dots indicate dead while green dots indicate alive. (C) Heatmap displays splicing pattern of the mRNA signatures. Color transition from green to red indicates the increasing PSI score of corresponding genes expression from low to high.
 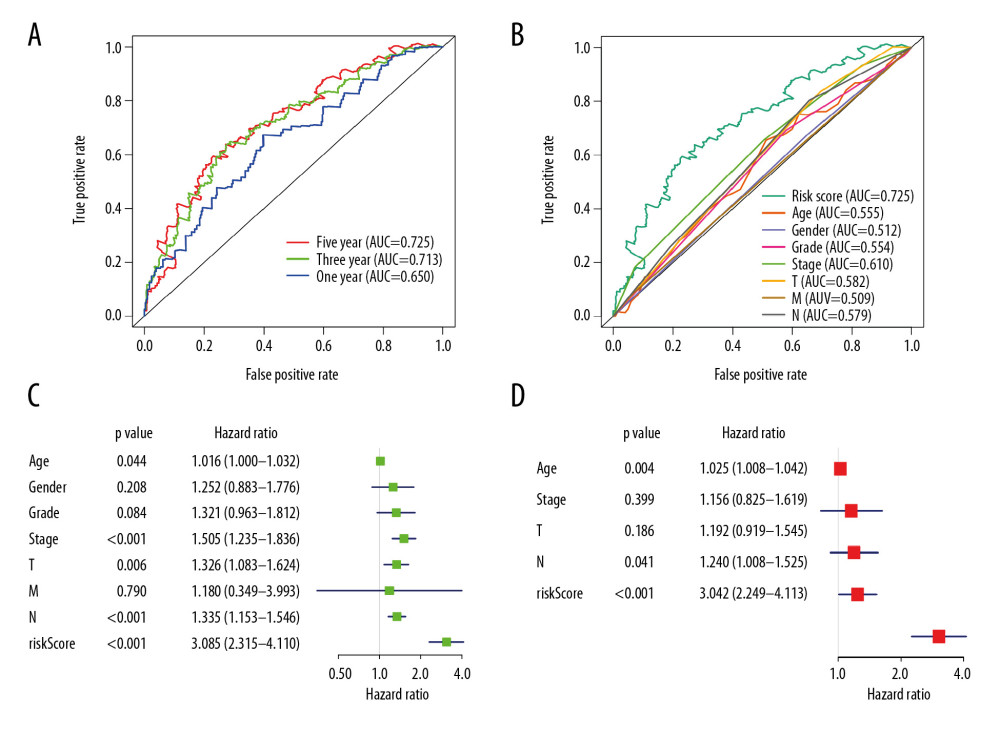 Figure 6. Evaluation of the prognostic and clinical factors in GC. (A) Receiver operating characteristic (ROC) analysis of the sensitivity and specificity of the survival time by the risk model in 1 year, 3 years, and 5 years. The black line evaluates whether the difference of 2 estimated AUCs at each timepoint is statistically significant. (B) Receiver operating characteristic (ROC) analysis of the sensitivity and specificity of the risk model and clinical traits, including age, sex, grade, and TNM stage. The univariate (C) and multivariate (D) Cox regression analysis for the risk model score and clinical traits, including age, sex, grade, and TNM stage.
 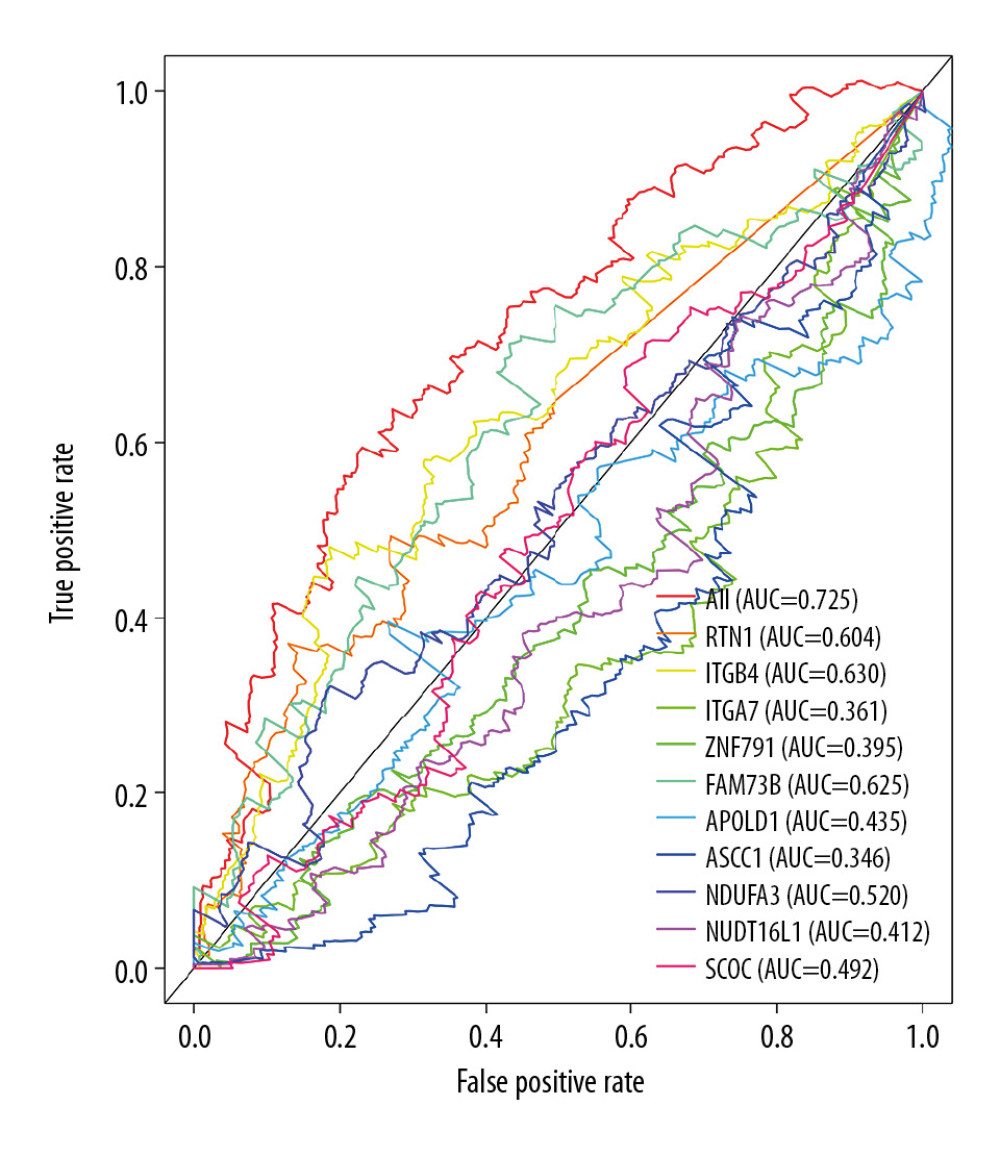 Figure 7. Receiver operating characteristic (ROC) analysis of the sensitivity and specificity of the risk model and prognostic DEAS expression.
 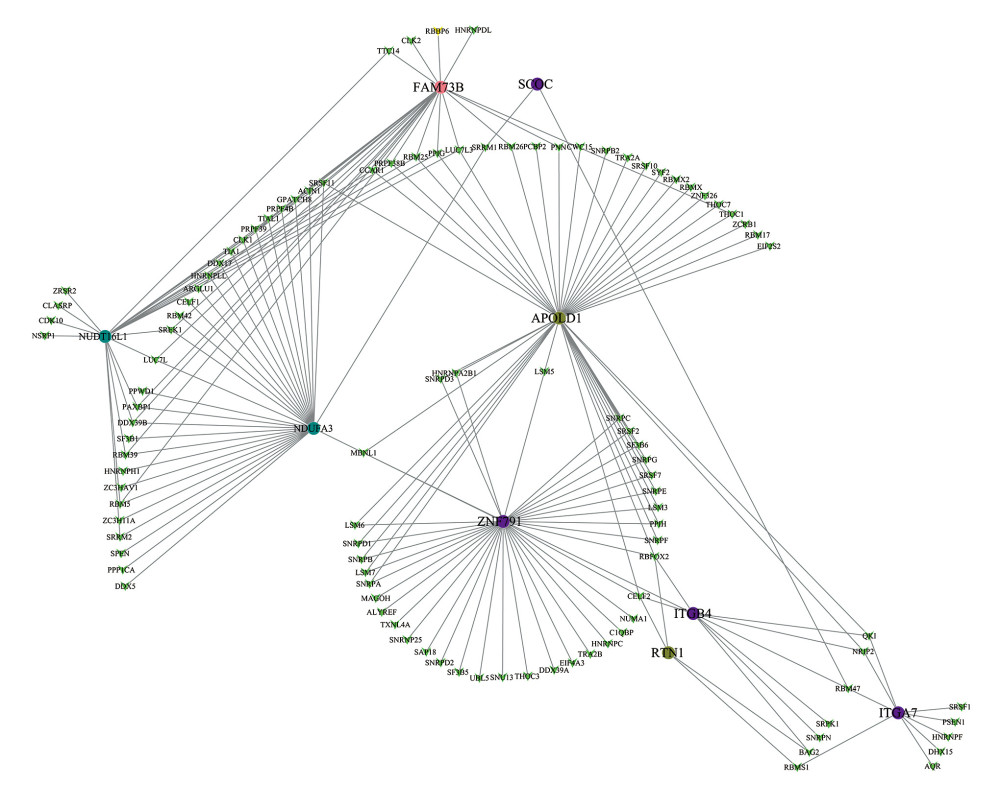 Figure 8. Correlation network between expression of survival AS factors and PSI values of AS genes generated using Cytoscape.
 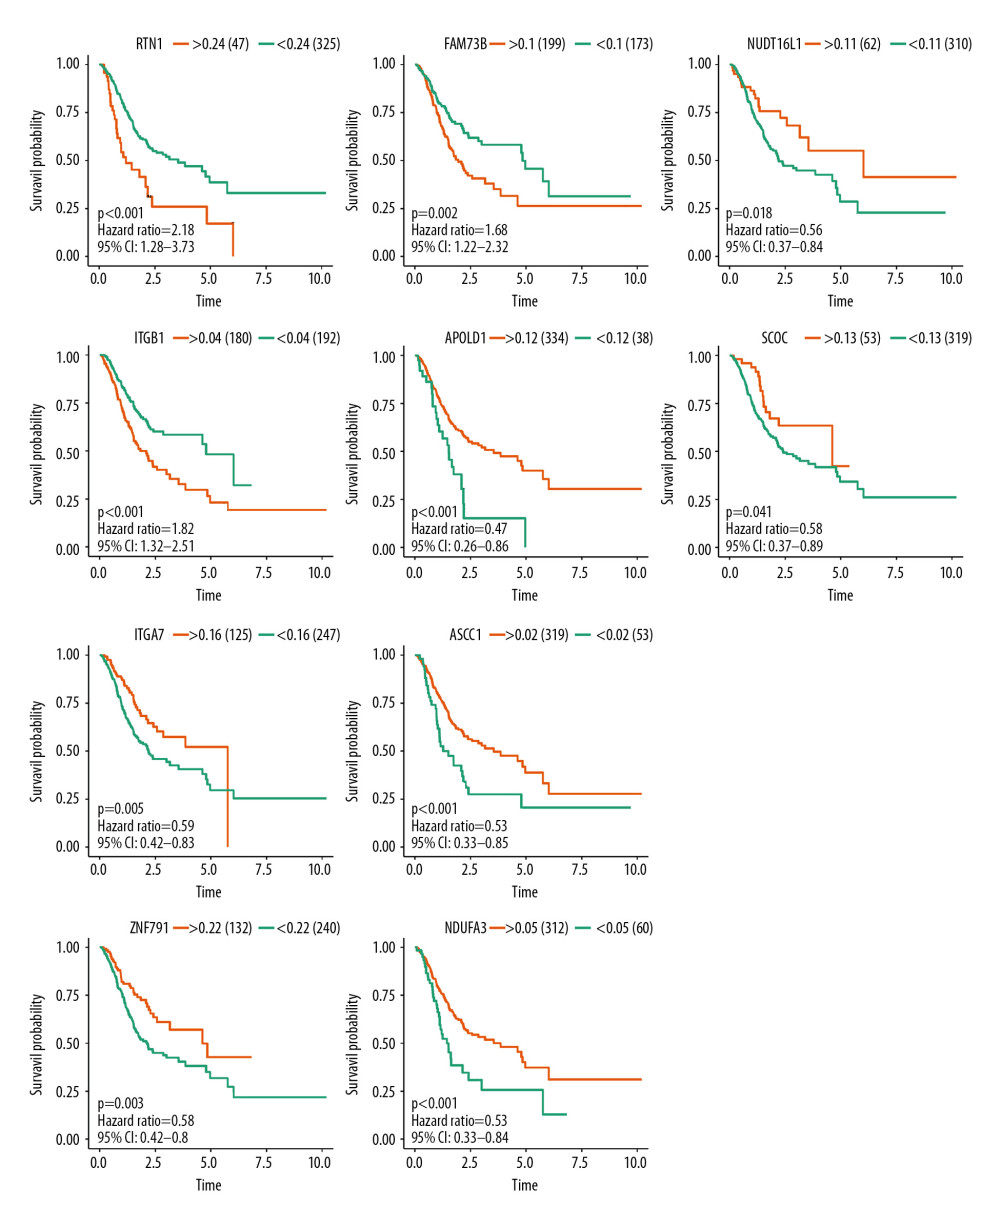 Figure 9. Survival analysis of the prognostic AS event associated with GC.
 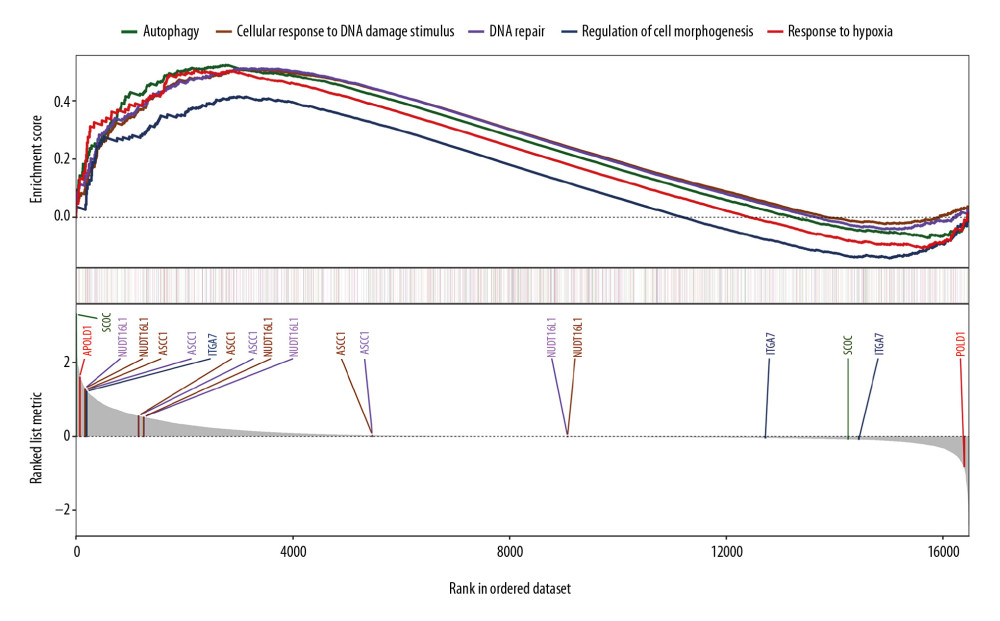 Figure 10. Gene set enrichment analysis for the prognostic AS event with gene sets in “C2: Canonical pathways” access from MSigDB database. Significant enrichment results include “autophagy”, “cellular response to DNA damage stimulus”, “DNA repair”, “regulation of cell morphogenesis”, and “response to hypoxia”. AS, alternative splicing; MSigDB, Molecular Signatures Database.
 References
1. Bray F, Ferlay J, Soerjomataram I, Global cancer statistics 2018: GLOBOCAN estimates of incidence and mortality worldwide for 36 cancers in 185 countries: Cancer J Clin, 2018; 68(6); 394-424
2. Biagioni A, Skalamera I, Peri S, Update on gastric cancer treatments and gene therapies: Cancer Metastasis Rev, 2019; 38(3); 537-48
3. Lin P, He RQ, Ma FC, Systematic analysis of survival-associated alternative splicing signatures in gastrointestinal pan-adenocarcinomas: EBioMedicine, 2018; 34; 46-60
4. Li Y, Yuan Y, Alternative RNA splicing and gastric cancer: Mutat Res, 2017; 773; 263-73
5. Miyamoto S, Nagamura Y, Nakabo A, Aberrant alternative splicing of RHOA is associated with loss of its expression and activity in diffuse-type gastric carcinoma cells: Biochem Biophys Res Commun, 2018; 495(2); 1942-47
6. Peng WZ, Liu JX, Li CF, hnRNPK promotes gastric tumorigenesis through regulating CD44E alternative splicing: Cancer Cell Int, 2019; 19; 335
7. Leff SE, Rosenfeld MG, Evans RM, Complex transcriptional units: Diversity in gene expression by alternative RNA processing: Annu Rev Biochem, 1986; 55; 1091-117
8. Maki R, Roeder W, Traunecker A, The role of DNA rearrangement and alternative RNA processing in the expression of immunoglobulin delta genes: Cell, 1981; 24(2); 353-65
9. Black DL, Mechanisms of alternative pre-messenger RNA splicing: Annu Rev Biochem, 2003; 72; 291-336
10. Wang ET, Sandberg R, Luo S, Alternative isoform regulation in human tissue transcriptomes: Nature, 2008; 456(7221); 470-76
11. Pan Q, Shai O, Lee LJ, Deep surveying of alternative splicing complexity in the human transcriptome by high-throughput sequencing: Nat Genet, 2008; 40(12); 1413-15
12. Lokody I, Alternative splicing: Aberrant splicing promotes colon tumour growth: Nat Rev Cancer, 2014; 14(6); 382-83
13. Wang ET, Sandberg R, Luo S, Alternative isoform regulation in human tissue transcriptomes: Nature, 2008; 456(7221); 470-76
14. Pan Q, Shai O, Lee LJ, Deep surveying of alternative splicing complexity in the human transcriptome by high-throughput sequencing: Nat Genet, 2008; 40(12); 1413-15
15. Dong X, Chen R, Understanding aberrant RNA splicing to facilitate cancer diagnosis and therapy: Oncogene, 2020; 39(11); 2231-42
16. Marco-Puche G, Lois S, Benítez J, Trivino JC, RNA-Seq perspectives to improve clinical diagnosis: Front Genet, 2019; 10; 1152
17. Kim P, Yang M, Yiya K, ExonSkipDB: Functional annotation of exon skipping event in human: Nucleic Acids Res, 2020; 48(D1); D896-907
18. Colaprico A, Silva TC, Olsen C, TCGAbiolinks: An R/Bioconductor package for integrative analysis of TCGA data: Nucleic Acids Res, 2016; 44(8); e71
19. Ryan M, Wong WC, Brown R, TCGASpliceSeq acompendium of alternative mRNA splicing in cancer: Nucleic Acids Res, 2016; 44(D1); D1018-22
20. Ryan MC, Cleland J, Kim R, SpliceSeq: A resource for analysis and visualization of RNA-Seq data on alternative splicing and its functional impacts: Bioinformatics, 2012; 28(18); 2385-87
21. Chen QF, Li W, Wu P, Alternative splicing events are prognostic in hepatocellular carcinoma: Aging (Albany NY), 2019; 11(13); 4720-35
22. Conway JR, Lex A, Gehlenborg N, UpSetR: An R package for the visualization of intersecting sets and their properties: Bioinformatics, 2017; 33(18); 2938-40
23. Xiong Y, Deng Y, Wang K, Profiles of alternative splicing in colorectal cancer and their clinical significance: A study based on large-scale sequencing data: EBioMedicine, 2018; 36; 183-95
24. Wai H, Douglas AGL, Baralle D, RNA splicing analysis in genomic medicine: Int J Biochem Cell Biol, 2019; 108; 61-71
25. Kuranaga Y, Sugito N, Shinohara H, SRSF3, a splicer of the PKM gene, regulates cell growth and maintenance of cancer-specific energy metabolism in colon cancer cells: Int J Mol Sci, 2018; 19(10) pii: E3012
26. Piva F, Giulietti M, Nocchi L, Principato G, SpliceAid: A database of experimental RNA target motifs bound by splicing proteins in humans: Bioinformatics, 2009; 25(9); 1211-13
27. Shannon P, Markiel A, Ozier O, Cytoscape: A software environment for integrated models of biomolecular interaction networks: Genome Res, 2003; 13(11); 2498-504
28. Liberzon A, Birger C, Thorvaldsdóttir H, The Molecular Signatures Database (MSigDB) hallmark gene set collection: Cell Syst, 2015; 1(6); 417-25
29. Gilbert W, Why genes in pieces?: Nature, 1978; 271(5645); 501
30. Pradella D, Naro C, Sette C, Ghigna C, EMT and stemness: Flexible processes tuned by alternative splicing in development and cancer progression: Mol Cancer, 2017; 16(1); 8
31. Li M, Jin Y, Sun WJ, Reduced expression and novel splice variants of ING4 in human gastric adenocarcinoma: J Pathol, 2009; 219(1); 87-95
32. Unoki M, Shen JC, Zheng ZM, Harris CC, Novel splice variants of ING4 and their possible roles in the regulation of cell growth and motility: J Biol Chem, 2006; 281(45); 34677-86
33. Meng H, Lu C, Mabuchi H, Tanigawa N, Prognostic significance and different properties of survivin splicing variants in gastric cancer: Cancer Lett, 2004; 216(2); 147-55
34. Shi Y, Chen Z, Gao J, Transcriptome-wide analysis of alternative mRNA splicing signature in the diagnosis and prognosis of stomach adenocarcinoma: Oncol Rep, 2018; 40(4); 2014-22
35. Lee JH, Seo YW, Park SR, Expression of a splice variant of KAI1, a tumor metastasis suppressor gene, influences tumor invasion and progression: Cancer Res, 2003; 63(21); 7247-55
36. Upheber S, Karle A, Miller J, Alternative splicing of KAI1 abrogates its tumor-suppressive effects on integrin αvβ3-mediated ovarian cancer biology: Cell Signal, 2015; 27(3); 652-62
37. Végran F, Mary R, Gibeaud A, Survivin-3B potentiates immune escape in cancer but also inhibits the toxicity of cancer chemotherapy: Cancer Res, 2013; 73(17); 5391-401
38. Ming XY, Fu L, Zhang LY, Integrin α7 is a functional cancer stem cell surface marker in oesophageal squamous cell carcinoma: Nat Commun, 2016; 7; 13568
39. Liu J, Zhang Z, Li X, Forkhead box C1 promotes colorectal cancer metastasis through transactivating ITGA7 and FGFR4 expression: Oncogene, 2018; 37(41); 5477-91
Figures
Figure 1. The flowchart to illustrate the workflow and the novel findings of this study.Figure 2. The landscape of aberrant alternative splicing events in GC cohort. (A) Upset plot of ASEs for the 7 different patterns, including AA as alternate acceptor site, AT as alternate terminator, ES as exon skip, AD as alternate donor site, AP as alternate promoter, ME as mutually exclusive exons, and RI as retained intron in the GC. (B) The expression heatmap of differentially expressed alternative splicing events (DEAS). (C) Volcano plots of the distribution of DEAS in the GC dataset. Red dots represent upregulated alternative splicing events whereas green dots represent downregulated ones.Figure 3. Forest plots for univariate Cox analysis of the survival associated AS events in GC cohort with hazard ratios and 95% confidence intervals. The color scale beside indicates the P values.Figure 4. Identification of prognostic model based on the AS events in GC. (A) Evaluation of OS-SEs with the coefficients calculated in the LASSO regression. (B) Plots of the cross-validation error rates. The dashes signify the value of the minimal error and greater λ value. (C) Survival curve of prognostic model in patients with GC for 2 groups (high-risk group vs. low-risk group) based on median-cut of risk score calculated by evaluation of OS-SEs with the coefficients calculated in LASSO regression.Figure 5. mRNA signature risk score distribution, heatmap of the mRNA expression profiles. Rows represent mRNAs, and columns represent patients. (A) The risk score curve, red dots show high-risk samples and while green dots show low-risk samples. (B) Distribution of patients’ survival status and overall survival (OS) times classified with risk scores, red dots indicate dead while green dots indicate alive. (C) Heatmap displays splicing pattern of the mRNA signatures. Color transition from green to red indicates the increasing PSI score of corresponding genes expression from low to high.Figure 6. Evaluation of the prognostic and clinical factors in GC. (A) Receiver operating characteristic (ROC) analysis of the sensitivity and specificity of the survival time by the risk model in 1 year, 3 years, and 5 years. The black line evaluates whether the difference of 2 estimated AUCs at each timepoint is statistically significant. (B) Receiver operating characteristic (ROC) analysis of the sensitivity and specificity of the risk model and clinical traits, including age, sex, grade, and TNM stage. The univariate (C) and multivariate (D) Cox regression analysis for the risk model score and clinical traits, including age, sex, grade, and TNM stage.Figure 7. Receiver operating characteristic (ROC) analysis of the sensitivity and specificity of the risk model and prognostic DEAS expression.Figure 8. Correlation network between expression of survival AS factors and PSI values of AS genes generated using Cytoscape.Figure 9. Survival analysis of the prognostic AS event associated with GC.Figure 10. Gene set enrichment analysis for the prognostic AS event with gene sets in “C2: Canonical pathways” access from MSigDB database. Significant enrichment results include “autophagy”, “cellular response to DNA damage stimulus”, “DNA repair”, “regulation of cell morphogenesis”, and “response to hypoxia”. AS, alternative splicing; MSigDB, Molecular Signatures Database. In Press
15 Apr 2024 : Laboratory Research
The Role of Copper-Induced M2 Macrophage Polarization in Protecting Cartilage Matrix in OsteoarthritisMed Sci Monit In Press; DOI: 10.12659/MSM.943738
07 Mar 2024 : Clinical Research
Knowledge of and Attitudes Toward Clinical Trials: A Questionnaire-Based Study of 179 Male Third- and Fourt...Med Sci Monit In Press; DOI: 10.12659/MSM.943468
08 Mar 2024 : Animal Research
Modification of Experimental Model of Necrotizing Enterocolitis (NEC) in Rat Pups by Single Exposure to Hyp...Med Sci Monit In Press; DOI: 10.12659/MSM.943443
18 Apr 2024 : Clinical Research
Comparative Analysis of Open and Closed Sphincterotomy for the Treatment of Chronic Anal Fissure: Safety an...Med Sci Monit In Press; DOI: 10.12659/MSM.944127
Most Viewed Current Articles
17 Jan 2024 : Review article
Vaccination Guidelines for Pregnant Women: Addressing COVID-19 and the Omicron VariantDOI :10.12659/MSM.942799
Med Sci Monit 2024; 30:e942799
14 Dec 2022 : Clinical Research
Prevalence and Variability of Allergen-Specific Immunoglobulin E in Patients with Elevated Tryptase LevelsDOI :10.12659/MSM.937990
Med Sci Monit 2022; 28:e937990
16 May 2023 : Clinical Research
Electrophysiological Testing for an Auditory Processing Disorder and Reading Performance in 54 School Stude...DOI :10.12659/MSM.940387
Med Sci Monit 2023; 29:e940387
01 Jan 2022 : Editorial
Editorial: Current Status of Oral Antiviral Drug Treatments for SARS-CoV-2 Infection in Non-Hospitalized Pa...DOI :10.12659/MSM.935952
Med Sci Monit 2022; 28:e935952