11 June 2021: Animal Study
Protective Effects of Bone Marrow Mesenchymal Stem Cells (BMMSCS) Combined with Normothermic Machine Perfusion on Liver Grafts Donated After Circulatory Death via Reducing the Ferroptosis of Hepatocytes
Dong Sun1BCDEF, Liu Yang1BCDEF, Weiping Zheng23CE, Huan Cao14BD, Longlong Wu5DF, Hongli Song26AG*DOI: 10.12659/MSM.930258
Med Sci Monit 2021; 27:e930258


Abstract
BACKGROUND: To improve the quality of liver grafts from extended-criteria donors donated after circulatory death (DCD), this study explored whether bone marrow mesenchymal stem cells (BMMSCs) combined with normothermic machine perfusion (NMP) have protective effects on DCD donor livers and the effects of ferroptosis in this procedure.
MATERIAL AND METHODS: Twenty-four male rat DCD donor livers were randomly and averagely divided into normal, static cold storage (SCS), NMP, and NMP combined with BMMSCs groups. Liver function, bile secretion, and pathological features of DCD donor livers were detected to evaluate the protective effects of NMP and BMMSCs on DCD donor livers. Hydrogen peroxide was used to induce an oxidative stress model of hepatocyte IAR-20 cells to evaluate the protective effects of BMMSCs in vitro.
RESULTS: Livers treated with NMP combined with BMMSCs showed better liver function, relieved histopathological damage, reduced oxidative stress injury and ferroptosis, and the mechanism of reduction was associated with downregulation of intracellular reactive oxygen species (ROS) and free Fe²⁺ levels. BMMSCs showed significant protective effects on the ultrastructure of DCD donor livers and ROS-induced injury to IAR-20 cells under electron microscopy. BMMSCs also significantly improved the expression level of microtubule-associated protein 1 light chain 3 (LC3)-II in both DCD donor livers and ROS-induced injured IAR-20 cells, including upregulating the expression of ferritin.
CONCLUSIONS: BMMSCs combined with NMP could reduce the level of ROS and free Fe²⁺ in oxidative stress damaged rat DCD donor livers, potentially reduce the ferroptosis in hepatocytes, and repair both morphology and function of DCD donor livers.
Keywords: mesenchymal stromal cells, Ferroptosis, Hepatocytes, Liver, Liver Transplantation, Living Donors, Mesenchymal Stem Cell Transplantation, Models, Animal, Organ Preservation, Perfusion
Background
Donation after circulatory death (DCD) has become an important organ source in the organ transplantation field. The emergence and application of DCD donor livers provides a possible solution to the clinical problem of donor liver shortage [1,2]. However, the DCD donor livers undergo long-term warm ischemic injury, ischemia-reperfusion (I/R) injury, and intracellular reactive oxygen species (ROS)-induced injury, resulting in damaging the structure and function of donor livers, which may lead to primary non-function and other complications after transplantation [3]. All these risks limit the application of DCD donor livers [4,5]. Therefore, the preservation method of DCD donor liver grafts needs to improve to alleviate hepatic injury prior to transplantation.
Static cold storage (SCS) is a classic method of donor liver preservation. However, the storage capacity of SCS for extended-criteria donor liver is limited, which is reflected in the fact that DCD donor livers do not have sufficient physiological reserves to tolerate the functional damage during preservation and transport, which makes DCD donor livers particularly sensitive to I/R and ROS injuries [6]. During hepatic I/R injury, extracellular ROS produced by neutrophils and Kupffer cells mediate the injury [7,8]. Yamada et al [9] found that the high serum ferritin level of the donor was an independent risk factor for hepatic injury after liver transplantation, based on the clinical data of pediatric living donor liver transplantation. Ferroptosis is a form of programmed cell death independent of apoptosis, which is closely associated with ROS and high levels of intracellular free iron [10]. Influenced by various factors, the sudden rise of intracellular ROS levels is the direct cause of ferroptosis in hepatocytes. Normothermic machine perfusion (NMP) is a new method of organ preservation, which mimics the normal metabolic state in vivo to protect the structure and function of the donor liver more effectively, with promising results potentially expanding the donor pool [11,12]. However, although the in vitro NMP system can increase the supply of nutrients and energy sources, it cannot completely avoid the oxidative stress damage caused by ischemia-reperfusion [13], activation of Kupffer cells and endothelial cells [14], and the damage of the bile duct [15]. Therefore, it is necessary to explore an optimized preservation scheme for DCD donor livers on the basis of NMP.
Mesenchymal stem cells (MSCs) are a type of non-hematopoietic stem cells originated from the stroma, which can alleviate hepatocyte damage and accelerate liver regeneration, participate in anti-inflammatory effects, and regulate immunity [16–21]. In this study, we aimed to explore the protective effects of bone marrow MSCs (BMMSCs) combined with NMP on DCD donor livers, from a new perspective on ferroptosis of hepatocytes, in order to provide new basic medical evidence for this type of preservation scheme for DCD donor livers.
Material and Methods
LABORATORY ANIMALS AND MATERIALS:
Sprague-Dawley (SD) rats were selected for all experiments, which were provided by the China National Institute for Food and Drug Control. Fifteen male SD rats (40–60 g) were used to extract BMMSCs, and 24 male SD rats (200–220 g) were used to acquire donor livers. This study was approved by the Ethics Committee of Tianjin first Central Hospital (Permit number: 2016-03-A1).
Laboratory reagents: Adenoviruses expressing the green fluorescence protein (GFP-Adv) of rats (Shanghai Gene Chem Co, Shanghai, China); Microtubule-associated protein 1 light chain 3 (LC3)-I/II rabbit mAb (Cell Signaling Technology, Boston, MA, USA); Prostaglandin-endoperoxide synthase 2 (PTGS2) rabbit antibody, P62 rabbit antibody, rabbit nuclear receptor co-activator 4 (NCOA4) pAb, and β-actin mouse mAb (Proteintech Inc., Rosemont, IL, USA); Rabbit Anti-glutathione peroxidase 4 (GPX4) antibody (BIOSS, Beijing, China); Rabbit Ferritin Heavy Chain (FTH1) mAb (Abcam, Cambridge, Cambridge, UK); Malondialdehyde (MDA) assay kit and Glutathione (GSH) assay kit (Nanjing Jiancheng Bioengineering Institute, Nanjing, China).
ISOLATION, CULTURE, AND CHARACTERIZATION OF BMMSCS:
BMMSCs were isolated aseptically from the femurs and tibias of SD rats. Identification and induction of adipogenic and osteogenic differentiation of BMMSCs were performed in vitro as described by Yang et al [21,22].
PROCUREMENT OF RAT DCD LIVER AND ESTABLISHMENT OF NMP SYSTEM AND COLONIZATION OF BMMSCS IN THE LIVER:
The protocol of treatment of DCD donor liver was described in our previous study [19–21]. The NMP system used in this study was a single-cycle system, mainly including a centrifugal pump, membrane oxygenator, organ chamber, heater, and a pressure and temperature monitor (Figure 1). The DCD liver was placed in the organ chamber and connected to the perfusion system in advance. The hepatic artery was ligated, and perfusate was injected through the portal vein and outflowed through the inferior vena cava. The GFP-BMMSCs tracer transduced by GFP-Adv was used to check the liver for the colonization of BMMSCs in the liver.
GROUP AND TREATMENT OF DCD DONOR LIVERS:
DCD donor livers were randomly and averagely divided into 4 groups according to our previous study after a 30 min warm ischemia process: I. Normal group: livers acquired for later use; II. SCS group: DCD livers flushed with 20 ml of University of Wisconsin solution (UW solution) at 4°C to wash out the blood in the liver, and then stored in UW solution at 4°C. III. NMP (P) group: DCD livers connected to the NMP system, and immediately perfused continuously by 2 ml normal saline injected slowly and uniformly through the portal vein cannula. IV. BMMSCs combined with NMP (BP) group: DCD livers connected to the NMP system, and immediately perfused continuously by 2 ml single cell suspension containing 1–3×10⁷ BMMSCs. The outflow perfusion from the inferior vena cava was collected and centrifuged with the supernatant for further testing. The liver samples of each group were randomly acquired and fixed in formalin, then fixed in 2.5% glutaraldehyde solution. Liver tissues were cut into small pieces and quickly cooled in liquid nitrogen [19,20].
OXIDATIVE STRESS MODEL OF HEPATOCYTES IN VITRO:
Rat hepatocyte IAR-20 cell line cells were cultured in α-minimum essential medium (MEM) containing 20% fetal bovine serum and 1% penicillin-streptomycin solution (normal complete medium) at 37°C with 5% CO2. The oxidative stress model of hepatocytes was induced by 1 μM hydrogen peroxide [19]. IAR-20 cells were divided into 4 groups: I. Mock group: IAR-20 cells cultured normally (1×10⁶/well, 6-well plate); II. Reactive oxygen species injury (ROS) group: IAR-20 cells cultured normally and were stimulated with 1 μM hydrogen peroxide for 45 min to simulate the injury process of oxidative stress during liver I/R injury in rats; III. Recover (R) group: IAR-20 cells cultured with complete serum-containing medium in normal condition for 6 h after injury, to simulate the perfusion process after liver I/R injury in rats; IV. Recover and BMMSCs (RB) group: IAR-20 cells cultured normally after being injured and then co-cultured with BMMSCs (1×10⁶/well, isolated in 0.8 μm Transwell chamber).
BIOCHEMICAL ANALYSIS OF LIVER FUNCTION:
The levels of alanine aminotransferase (ALT) and aspartate aminotransferase (AST) in the outflow perfusion from the inferior vena cava were measured.
ANALYSIS OF OXIDATIVE STRESS INJURY:
Liver tissues were acquired to analyze the oxidative stress injury, which included MDA to determine the degree of lipid peroxidation and GSH to determine the degree of peroxidative damage and antioxidant capacity, following the instructions of the kits. The intracellular ROS level of IAR-20 cells was measured by the ROS Assay Kit (Shanghai Beyotime Biotechnology Co, Shanghai, China) according to the manufacturer’s instructions.
CELL COUNTING KIT-8 (CCK-8):
CCK-8 (Solarbio Co, Beijing, China) was used to detect cell viability (5000 cells/tube), and carried out according to the manufacturer’s instructions.
HISTOPATHOLOGICAL AND IMMUNOFLUORESCENCE (IF) OF THE LIVER:
The histopathological changes in the liver tissues were observed after staining with hematoxylin and eosin (HE). I/R injury was graded according to the histological criteria described by Suzuki [23]. It was scored independently by 2 experienced pathologists blinded to the group to which the samples belonged. A third expert was asked to score independently in case of discrepancy. The expression of GPX4 and PTGS2 in liver tissues was determined by IF. The operation referred to our previous research [24].
DETECTION OF ULTRASTRUCTURE OF HEPATOCYTES:
The ultrastructure of hepatocytes in liver tissues and IAR-20 cells was observed under a transmission electron microscope (TEM). Fresh liver tissues were cut into 1×1×2 mm pieces, and IAR-20 cells were centrifugated to collect the cell deposition. The tissues and cells were fixed with 2.5% glutaraldehyde solution, embedded, and ultrathin sectioned.
WESTERN BLOTTING:
The total cellular proteins of the liver tissues and IAR-20 cells were determined by western blotting, labeled with target antibodies, including GPX4 (1: 750), PTGS2 (1: 500), LC-3-I/II (1: 1000), p62 (1: 500), FTH1 (1: 500), NCOA4 (1: 500), and analyzed using Alpha View SA software (version 3.4.0; San Jose, CA, USA) [25].
STATISTICAL ANALYSIS:
SPSS statistical software package (version 17.0; IBM Corp., Armonk, NY, USA) and Graphpad Prism statistical software package (version 5.0; Graphpad Software Inc., La Jolla, CA, USA) were used for statistical analysis. Normally distributed data were presented as means±standard deviation. Different groups of data were compared by the analysis of variance (ANOVA), and Student-Newman-Keuls post hoc test was used for further pairwise comparison. Differences were considered to be statistically significant with
Results
MORPHOLOGY AND PHENOTYPIC ANALYSIS OF BMMSCS AND LIVER COLONIZATION:
BMMSCs grew adherently as long spindle-shaped in a whirlpool or paralleled pattern (Figure 2A). BMMSCs could be induced to differentiate into adipocytes which showed multiple red lipid droplets in the cytoplasm stained by Oil Red O, and osteoblasts which showed black fine granular or clump-like calcium salt deposits in the cytoplasm stained by Von Kossa calcium stain (Figure 2B, 2C).
After transduction with GFP-Adv, more than 85% of BMMSCs expressed GFP (Figure 2D, 2E); therefore, GFP was successfully transduced into BMMSCs as GFP-BMMSCs. Frozen sections of liver treated by NMP combined with GFP-BMMSCs for 6 h revealed that BMMSCs were colonized in the hepatic sinusoids (Figure 2F).
QUALITY OF DCD DONOR LIVERS AMELIORATED BY NMP SYSTEM COMBINED WITH BMMSCS:
ALT and AST of the outflow perfusion from the inferior vena cava gradually increased with longer perfusion times. The levels of ALT (P=0.003) and AST (P=0.001) in the BP group were significantly lower than those in the P group. Lactate acid was the highest immediately after perfusion, decreased gradually and stabilized with increased perfusion time, and then increased after 6 h of perfusion. The levels of lactic acid in the BP group were lower than those in the P group at 6 h, but the difference was not statistically significant (Table 1).
After 6 h of SCS, the liver was swollen, uneven in texture, and congested, showing a patchy appearance. The livers in the P group and BP group were not significantly swollen and congested and were uniformly yellow after 6 h of perfusion (Figure 3A). The SCS group showed vacuolar degeneration of the hepatocytes, with severe cellular edema and hepatic sinusoidal congestion, while the perfusion group showed nearly no vacuolar degeneration, sinusoidal congestion, or inflammatory cell infiltration. Hepatic sinusoidal congestion and hepatocyte edema were milder in the BP group than those of the P group, and the Suzuki’s score in the BP group was significantly lower than the P and SCS groups (P<0.001, Table 1, Figure 3B).
FERROPTOSIS OF DCD DONOR LIVER ALLEVIATED BY BMMSCS COMBINED WITH NMP:
Expression levels of GPX4 and PTGS2 in liver tissues was detected by IF and western blotting. The expression levels of GPX4 in the BP and P group were significantly higher than those in the SCS group (P<0.001, P=0.004), and the expression level of PTGS2 in the BP group was significantly lower than that in the SCS group (P<0.001, Figure 4A, 4B). MDA in the BP group and P group were significantly lower than those in the SCS group (P<0.001, P<0.001), and GSH in the BP and P groups were significantly higher than those in the SCS group (P<0.001, P<0.001, Figure 4C, 4D). The Fe2+ release levels in liver tissues were measured, which were significantly higher in the SCS group than both the P group (P<0.001) and BP group (P<0.001). There was no significant difference in the Fe2+ release levels between the P and BP groups (P=0.020, Figure 4E).
The ultrastructure of mitochondria was observed under TEM. The mitochondria of hepatocytes in SCS group showed severe edema, obvious vacuolar degeneration, partial mitochondrial necrosis and shrinkage, and disordered mitochondrial crest structure, which mostly disappeared. The mitochondria in the BP and P groups showed nearly no swelling or vacuole degeneration, with intact mitochondrial crest structure and less mitochondrial damage (Figure 4F).
EFFECTIVELY RESTORED VIABILITY OF IAR-20 CELLS RESUMING NORMAL CULTURE COMBINED WITH BMMSCS AFTER ROS STIMULATION: The CCK-8 assay showed that the cell viability decreased significantly after ROS injury induced by the addition of hydrogen peroxide (P<0.001), and the cell viability was significantly restored after resuming normal culture (P=0.035). When co-cultured with BMMSCs, the cell viability recovered more significantly (P<0.001, Figure 5A), indicating that BMMSCs had protective effects on the ROS-induced injury to IAR-20 cells.
RESUMING NORMAL CULTURE COMBINED WITH BMMSCS COULD EFFECTIVELY ALLEVIATE THE FERROPTOSIS INDUCED BY ROS IN IAR-20 CELLS: The intracellular concentration of free Fe2+ in IAR-20 cells increased significantly when stimulated by hydrogen peroxide (P<0.001). After resuming normal culture, the intracellular free Fe2+ reduced significantly (P=0.010). And the intracellular free Fe2+ of IAR-20 cells in the RB group showed significant decrease compared with that in the R group (P=0.003, Figure 5B). The level of intracellular ROS increased significantly after hydrogen peroxide treatment, and the level of ROS in IAR-20 cells in the RB group was significantly lower than that in the R group (P=0.002, Figure 5C, 5D). Detection of ferroptosis-related proteins showed that hydrogen peroxide could induce ferroptosis in IAR-20 cells. Resuming normal complete culture and co-cultured with BMMSCs significantly alleviated the ferroptosis of hepatocytes (Figure 5E).
RESUMING NORMAL CULTURE AND CO-CULTURED WITH BMMSCS REDUCED THE ROS-INDUCED MITOCHONDRIAL DAMAGES IN IAR-20 CELLS OBSERVED UNDER TEM: Normal IAR-20 cells showed intact cell morphology and normal mitochondria structure observed under TEM. When stimulated by hydrogen peroxide, the intracellular mitochondria were destroyed, the cell ridges were twisted and broken, and a large number of autophagy vacuoles appeared in the cytoplasm. After resuming normal culture for a period of time, the hepatocytes recovered to a certain extent. Morphology of the hepatocytes in the RB group showed less intracellular autophagy vacuoles and better mitochondrial morphology, which was better than in both the R group and ROS group (Figure 5F).
BMMSCS COMBINED WITH NMP IMPROVED THE EXPRESSION LEVEL OF FERRITINOPHAGY-RELATED PROTEINS:
The ultrastructure showed a significant increase of autophagic vacuoles during ferroptosis. The autophagy protein (LC-3-I/II) and ferritinophagy-related proteins (FTH1, P62, and NCOA4) in IAR-20 cells and liver tissues were detected to further explore the molecular mechanism of iron ferroptosis. IAR-20 cells showed increased LC-3-II levels (P < 0.001) and were significantly decreased in the R group (P=0.005). LC-3-II in the RB group was significantly lower than that in the R group and ROS group (P<0.001, P=0.001, Figure 6A). Expression of the ferritinophagy-related proteins in the RB group was significantly higher than that in the ROS group. LC-3-II in the liver tissues of the P group and BP group was significantly lower than that in the SCS group (P<0.001, P<0.001), while there was no significant difference between the P and BP groups (P=0.172). In addition, BMMSCs and NMP effectively increased the expression levels of FTH1 and P62 proteins (P=0.001, P<0.001, Figure 6B).
Discussion
DCD donor livers are an effective supplement to expand the available organ donor pool and potentially meeting the shortage of liver grafts. Assessment of methods of preservation of donor livers is currently very pressing for the transplantation community, in order to effectively alleviate donor shortages. SCS protocols showed several deficiencies in organ preservation and transportation, which restricted the application of DCD livers and affected the long-term effect of clinical liver transplantation [6]. The emergence of NMP has improved the quality of DCD donor livers greatly, prevented hepatocyte damage caused by ischemia, promoted the excretion of hepatic metabolic waste, and effectively eliminated inflammatory factors. In addition, the NMP system was able to assess the function of donor organs during the preservation process before transplantation, which would significantly alleviate the injuries that occurred during ischemia-reperfusion of DCD livers [26]. The NMP system we used in this study was a self-modified single-cycle system. Based on our previous studies, the donor liver function was best at 6 h perfusion by the NMP system [20,27].
Our study indicated that BMMSCs could be colonized in the hepatic sinusoids during the repair procedure of DCD livers, and then improved the quality of DCD livers, relieved swelling and congestion, ameliorated the pathological damage, and alleviated hepatocytes of DCD donor livers, which was superior to NMP alone. These results indicated that BMMSCs combined with NMP had the effects of reducing hepatocyte damage, accelerating liver regeneration, and alleviating I/R injury and oxidative stress injury. Moreover, BMMSCs combined with NMP significantly alleviated hepatic pathology and I/R injuries, and reduced hepatocyte apoptosis, which verified that BMMSCs could increase the protective effects of NMP on DCD donor livers [28,29].
The extended-criteria donor livers were more vulnerable to injury during the I/R process, due to their low antioxidant defense capacity and high ROS production by the mitochondrial xanthine/xanthine oxidase system [30,31]. Basic research showed that ferroptosis occurred during the I/R process in the mouse liver, which was involved in the I/R injury [32]. Considering all these adverse factors in DCD donor livers, it is promising to explore how to alleviate the excessive oxidative stress response of DCD donor livers and ferroptosis caused by oxidative stress. By detecting MDA and GSH related to the oxidative stress injury of DCD donor livers [33], we found that BMMSCs combined with NMP significantly inhibited the expression of MDA, reduced the release of ROS, and increased the production of GSH, when compared with the severity of oxidative stress injury of DCD livers preserved by SCS and simple NMP. BMMSCs combined with NMP played an important role in alleviating the oxidative stress injuries of DCD donor livers. In addition, our study suggests that BMMSCs combined with NMP and simple NMP can reduce the accumulation of tissue Fe2+ and alleviate the ferroptosis-related oxidative stress injury, which were better than with SCS. However, there was no statistically significant difference between the BMMSCs combined with NMP and NMP group, which was not consistent with the results of ex vivo research. The discrepancy may be associated with the complicated immune system in vivo, which needs further study.
Mitochondria are very sensitive to hypoxia and oxidative stress, and are vulnerable to ROS injury [34]. Irreversible mitochondrial oxidative damage appeared first in the early stage of liver reperfusion. Both the degree of activation of Kupffer cells and endothelial cells and ROS production were relatively higher in NMP compared with hypothermia perfusion, which would lead to hepatocyte mitochondrial damage [14,35]. During the warm ischemia of DCD livers, hypoxia led to further increased oxidative stress and decreased mitochondrial biological function. The sudden increase of oxygen content after reperfusion produces mitochondrial ROS, leading to oxidative stress damage [36]. It was confirmed in the liver reperfusion model that BMMSCs combined with NMP protected the morphology of mitochondria, reduced the level of intracellular ROS, and reduced ferroptosis in hepatocytes in the DCD donor liver model.
GPX4 is an important peroxide decomposition enzyme widely present in the body. It can catalyze GSH into L-Glutathione (oxidized), reduce toxic peroxides to non-toxic hydroxyl compounds, and promote the decomposition of hydrogen peroxide, thereby protecting cell membrane structure and function from interference and injury by peroxides. PTGS2, also known as cyclooxygenase 2, is a dual enzyme that functions as cyclooxygenase and peroxidase. Both GPX4 and PTGS2 are biomarkers of ferroptosis. We detected the levels of GPX4 and PTGS2 proteins. A large number of ferroptosis occurred in hepatocytes during the SCS procedure, while the ferroptosis in NMP preservation was significantly lower than that of SCS. The preservation protocol of BMMSCs combined with NMP had better effects in reducing ferroptosis in DCD donor livers due to decreased intracellular ROS level.
To further explore the role and mechanism of BMMSCs combined with BMMSCs in reducing hepatocyte ferroptosis, we established an in vitro model to simulate oxidative stress in hepatocytes [37,38]. The results showed that, when the hepatocytes were stimulated by hydrogen peroxide in vitro, the intracellular levels of ROS and free Fe2+ increased significantly, inducing ferroptosis and decreased cell viability. When the ROS damage was eliminated and the normal culture environment was resumed, the intracellular levels of ROS and free Fe2+ decreased, which may be related to the mechanism of self-repair and ROS-efflux. The effects were stronger when hepatocytes were co-cultured with BMMSCs, indicating that the anti-inflammatory and immunoregulatory effects induced by the paracrine function of BMMSCs had strong protective effects on the high ROS-induced damage to the hepatocytes, reducing ferroptosis. The ultrastructure showed that the number of phagosomes present in the cells changed significantly in addition to mitochondrial damage. The role of autophagy in the process of cell death or survival is unclear [39]. However, some studies have shown that the increase of autophagosomes and autophagy is an important upstream regulatory factor of ferroptosis, and its mechanism includes ferritinophagy.
Ferritinophagy is an important pathophysiological process that regulates the levels of ferritinophagy-related proteins such as FTH1 (iron ion detoxification and storage), NCOA4, and P62 (induced autophagy degradation of ferritin and the release of iron ions), which plays an important role in the regulation of intracellular levels of free iron ions [40,41]. Blocking the release of ferritinophagy-related proteins to control the levels of intracellular iron is a novel concept in treatment [42]. After detecting the levels of related proteins, the ex vivo and in vitro molecular results showed that, when the DCD donor livers were preserved by BMMSCs combined with NMP, autophagy was decreased, thereby upregulating the level of ferritinophagy-related proteins, and the intracellular iron ions were fixed to ferritinophagy-related proteins, finally stabilizing the intracellular level of free Fe2+ [43]. However, when compared with the normal hepatocytes, we found the levels of ferritinophagy-related proteins of hepatocytes were still complex and different, especially in the ex vivo donor livers, which may be due to the activation and regulation of the autophagy system induced by I/R and other factors, such as the interplay with other cells in liver tissues (eg, endothelial cells and Kupffer cells). In future research, we plan to study in depth the related molecules and immune mechanisms of ferroptosis and ferritinophagy. In brief, ferroptosis of hepatocytes play an important role in the preservation and transport of DCD donor liver.
BMMSCs combined with NMP systems could stabilize the intracellular levels of free Fe2+ by regulating the intracellular levels of ROS, reducing the degradation of ferritin induced by ferritinophagy, and upregulating the level of intracellular iron ions fixed to ferritinophagy-related proteins. With the participation of various factors, hepatocyte ferroptosis induced by I/R and high intracellular ROS was alleviated, which showed ideal protective effects on the structure and function of DCD donor livers.
In conclusion, our study indicates that BMMSCs combined with NMP, as a new strategy of cell therapy, should be considered to have a broad prospect of clinical application and may play a vital role in expanding the source of donors and alleviating the organ shortage.
Conclusions
This study demonstrates that BMMSCs combined with NMP system could alleviate the oxidative stress injuries in rat DCD donor livers, and potentially reduces hepatocyte ferroptosis, with better protective effects than the classic SCS protocol. These results will provide basic medical research evidence for a novel technique of DCD liver grafts storage.
Figures
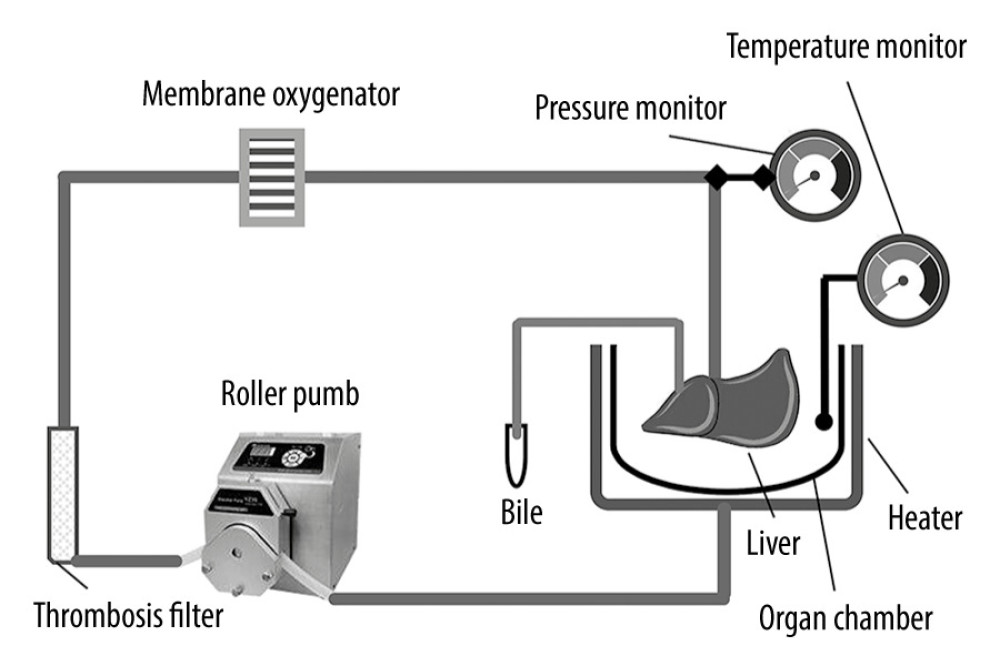 Figure 1. Schematic diagram of the NMP system. The NMP system is a single-cycle system that mainly includes centrifugal pumps, membrane oxygenators, organ chambers, heaters, and pressure and temperature monitors. NMP – normothermic machine perfusion.
 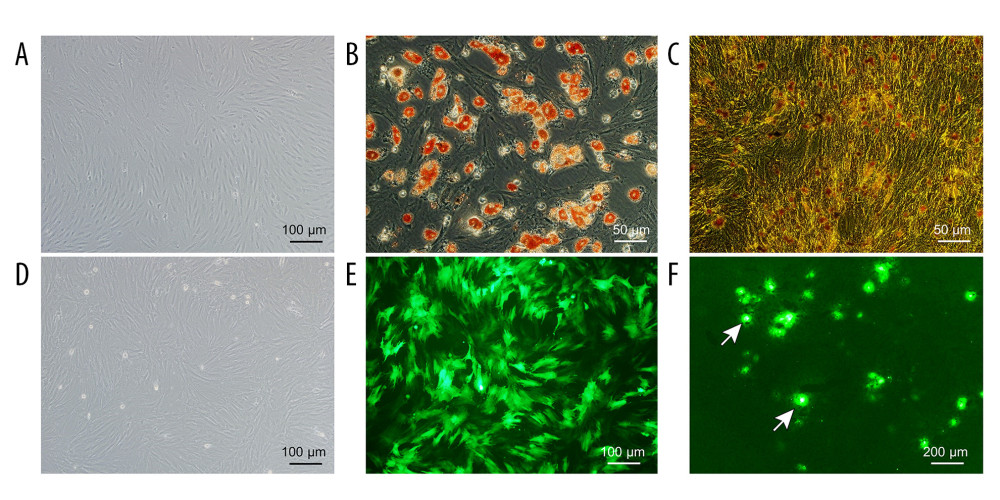 Figure 2. Evaluation of the NMP system and BMMSCs. (A) Morphology characteristics of third-generation BMMSCs; (B) Adipogenic induction; (C) Osteogenic induction; (D) Bright-field image of GFP-BMMSCs; (E) Fluorescent image of GFP-BMMSCs showing that >85% of the cells are transduced with GFP; (F) Fluorescent image of DCD donor liver perfused by BMMSCs combined with NMP at 6 h, the arrow indicates GFP-BMMSCs colonized in hepatic sinusoids. BMMSCs – bone marrow mesenchymal stem cells; GFP – green fluorescent protein; NMP – normothermic machine perfusion.
 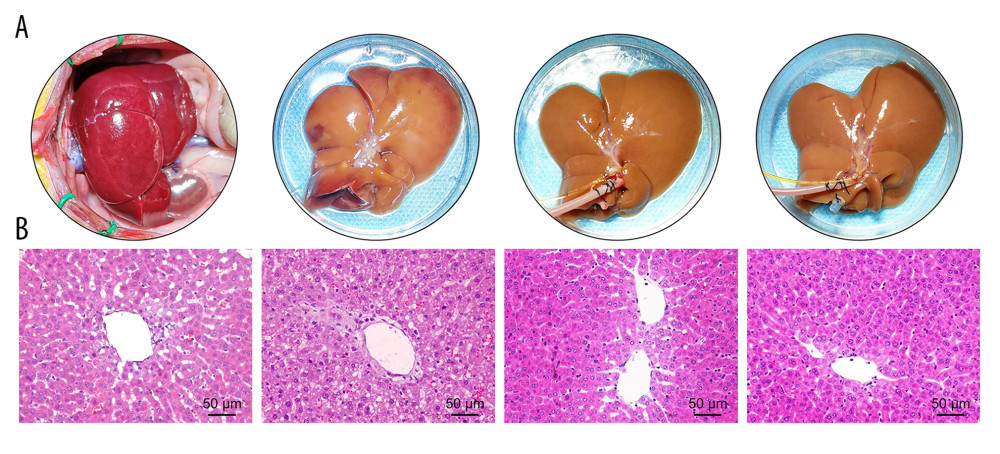 Figure 3. Quality of DCD donor livers ameliorated by BMMSCs combined with NMP. (A) Gross appearance of DCD donor livers; (B) Histopathological change of DCD donor livers. I: warm ischemia at 30 min; II: 6 h in the SCS group; III: 6 h in the P group; IV: 6 h in the BP group. BMMSCs – bone marrow mesenchymal stem cells; P – NMP; BP – NMP combined with BMMSCs; NMP – normothermic machine perfusion; SCS – static cold storage.
 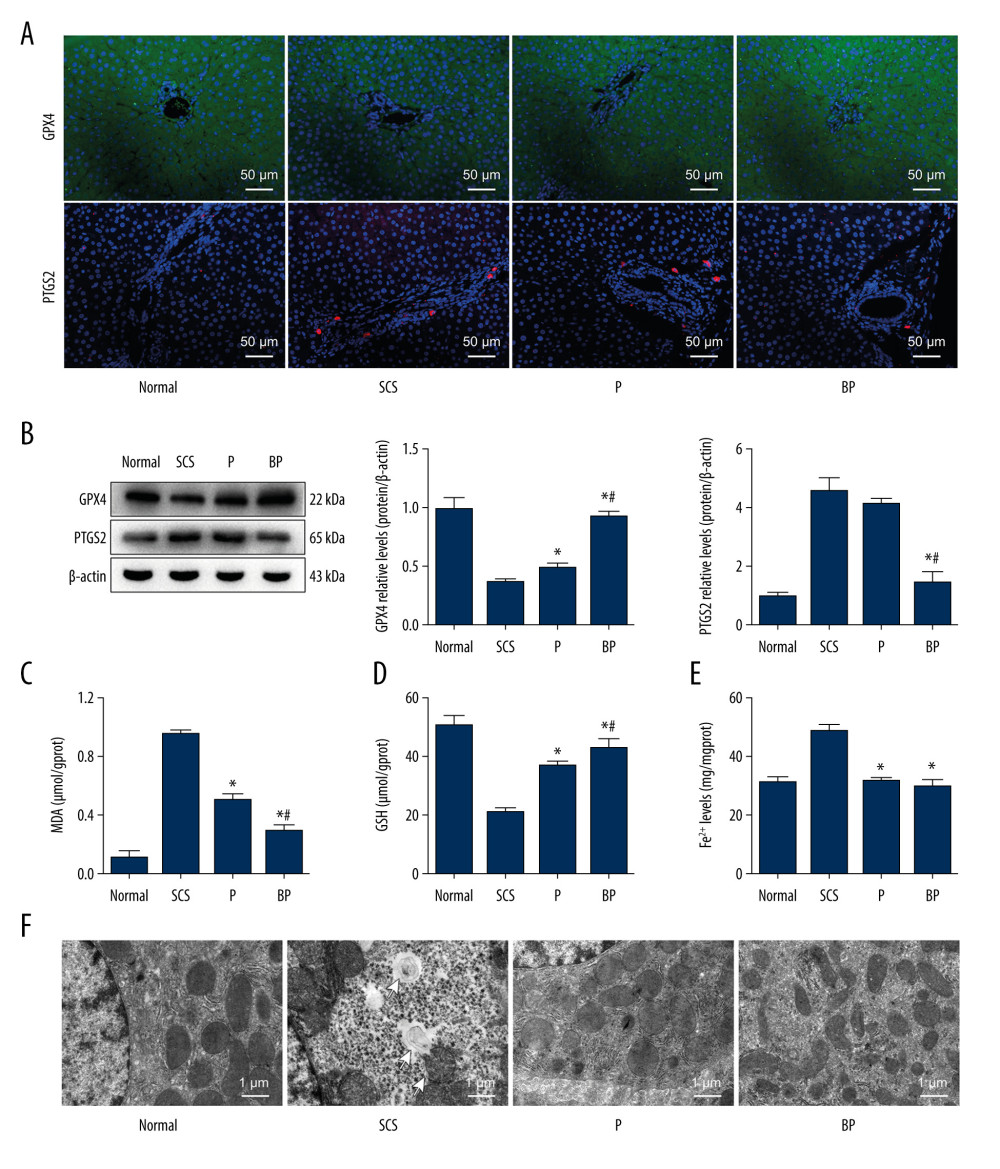 Figure 4. Oxidative stress and ferroptosis of DCD donor liver alleviated by BMMSCs. (A) IF of GPX4 and PTGS2 in hepatic tissues of different groups. GPX4 is shown in green, PTGS2 is shown in red, and the DAPI-stained nuclei are shown in blue. (B) Western blot of GPX4 and PTGS2 in hepatic tissues of different groups. The expression levels of GPX4 in the BP group were significantly higher than those in the P group (P=0.004) and SCS group (P<0.001). The expression levels of PTGS2 in the BP group were significantly lower than those in the P group (P=0.002) and SCS group (P<0.001). (C) MDA in hepatic tissues of different groups (P group vs SCS group, P<0.001; BP group vs SCS group, P<0.001; BP group vs P group, P=0.001). (D) GSH in hepatic tissues of different groups (P group vs SCS group, P 0.001; BP group vs SCS group, P<0.001; BP group vs P group, P=0.132). (E) The levels of Fe2+ release in different groups, which were significantly lower in the P and BP groups than those in the SCS group (P group vs SCS group, P<0.001; BP group vs SCS group, P<0.001; BP group vs P group, P=0.020). (F) The ultrastructure of hepatic tissues in different groups. The mitochondria of hepatocytes in SCS group showed severe edema and vacuolar degeneration, with irreversibly damaged mitochondria, partial mitochondrial necrosis and lysis (shown in white arrow), and disordered mitochondrial crest structure, which mostly disappeared. The mitochondria in the BP group and P group showed almost no swelling or vacuole degeneration, with intact mitochondrial crest structure and less irreversible mitochondrial damage. * P<0.05 vs the SCS group, # P<0.05 vs the P group. DCD – donation after circulatory death; SCS – static cold storage; P – NMP; BP – BMMSCs combined with NMP; NMP – normothermic machine perfusion; BMMSCs – bone marrow mesenchymal stem cells.
 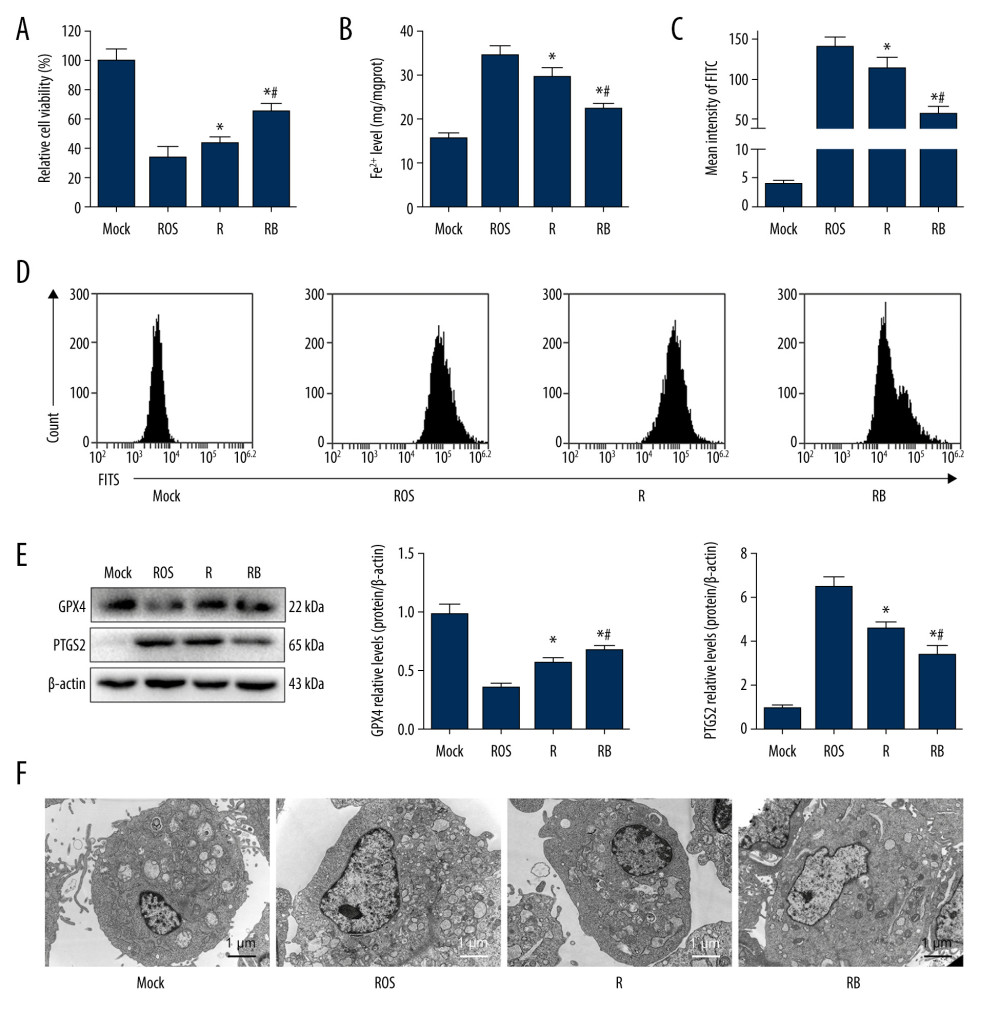 Figure 5. Alleviated hydrogen peroxide-induced ferroptosis in IAR-20 cells co-cultured with BMMSCs. (A) Relative vitality of IAR-20 cells in different groups, which was significantly higher in the R group and RB group than that in the ROS group (R group vs ROS group, P=0.035; RB group vs ROS group, P<0.001; RB group vs R group, P<0.001). (B) Intracellular concentrations of free Fe2+ in IAR-20 cells of different groups, which were significantly lower in the R group and RB group than that in the ROS group (R group vs ROS group, P=0.010; RB group vs ROS group, P<0.001; RB group vs R group, P=0.003). (C, D) Intracellular concentrations of ROS (graded by the fluorescent intensity) in IAR-20 cells of different groups, which were significantly lower in the R group and RB group than that in the ROS group (R group vs ROS group, P=0.036; RB group vs ROS group, P<0.001; RB group vs R group, P=0.002). (E) Western blot of GPX4 and PTGS2 in IAR-20 cells of different groups. The expression levels of GPX4 in the RB group were significantly higher than those in the R group and ROS group (R group vs ROS group, P=0.001; RB group vs ROS group, P<0.001; RB group vs R group, P=0.011). The expression levels of PTGS2 in the RB group were significantly lower than those in the R group and ROS group (R group vs ROS group, P=0.002; RB group vs ROS group, P<0.001; RB group vs R group, P=0.005). (F) The ultrastructure of IAR-20 cells in different groups. The Mock group showed intact cellular morphology, with normal mitochondrial structure. The ROS group showed destroyed intracellular mitochondria, with twisted and broken cell ridges, and a large number of autophagy vacuoles in the cytoplasm. Morphology of the IAR-20 cells in the RB group was significantly better than that of the R group and ROS group, with significant fewer intracellular autophagy vacuoles and better mitochondrial morphology. * P<0.05 vs the ROS group, # P<0.05 vs the R group. Mock group – normal IAR-20cells; ROS group – hydrogen peroxide-induced injury at 45 min; R group – recovered by resuming normal culture for 6 h after injury; RB group – recovered by resuming normal culture and co-cultured with BMMSCs for 6 h after injury. ROS – reactive oxygen species; GPX4 – glutathione peroxidase 4; PTGS2 – prostaglandin-endoperoxide synthase 2; FITC – fluorescein isothiocyanate isomer.
 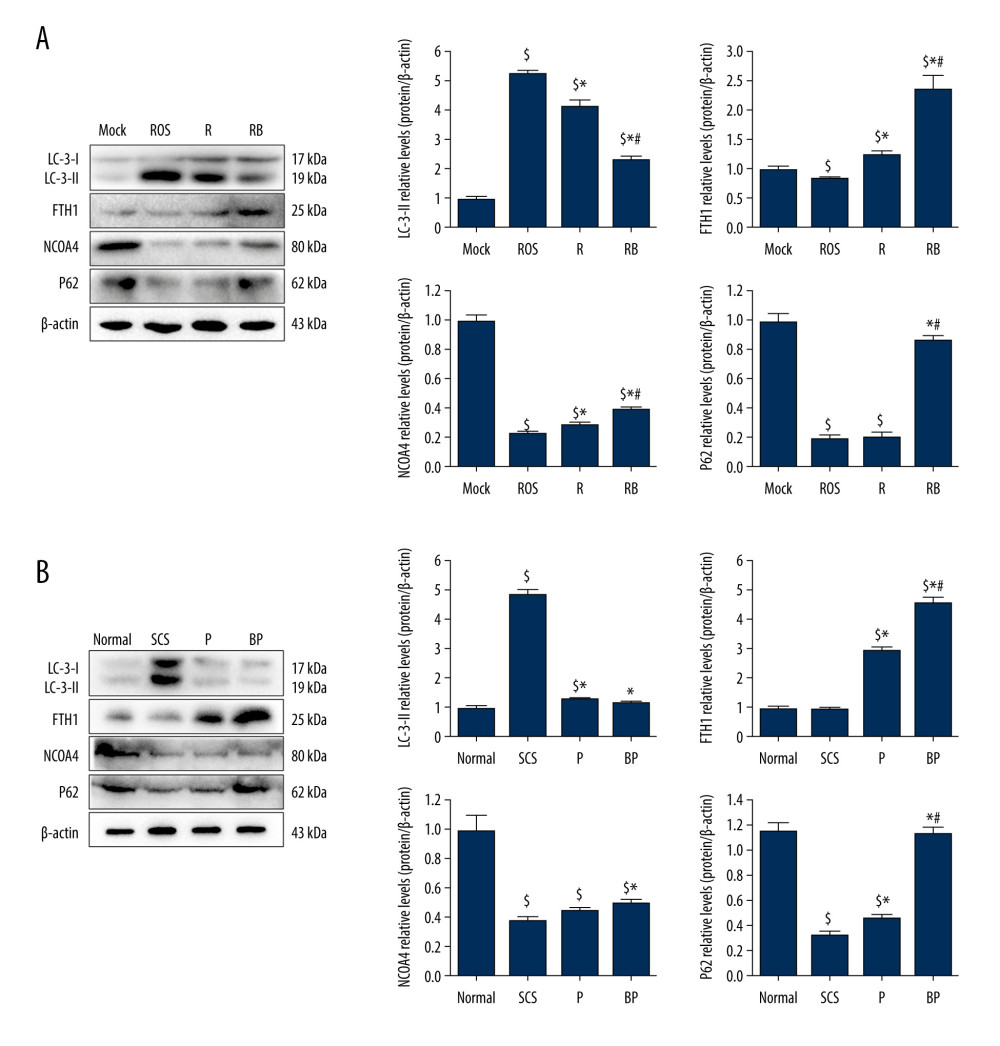 Figure 6. Decreased autophagy and increased expression of ferritinophagy-related proteins in IAR-20 cells co-cultured with BMMSCs. (A) Western blot of LC-3, FTH1, NCOA4 and P62 in IAR-20 cells of different groups. Expression level of LC-3-II in the RB group was significantly lower than that in the R group and ROS group (ROS group vs Mock group, P<0.001; R group vs Mock group, P<0.001; R group vs ROS group, P=0.005; RB group vs Mock group, P<0.001; RB group vs ROS group, P<0.001; RB group vs R group, P=0.001). Expression level of FTH1 in the RB group was significantly higher than that in the R group and ROS group (ROS group vs Mock group, P=0.040; R group vs Mock group, P=0.014; R group vs ROS group, P=0.003; RB group vs Mock group, P=0.003; RB group vs ROS group, P=0.002; RB group vs R group, P=0.005). Expression level of NCOA4 in the RB group was significantly lower than that in the R group and ROS group (ROS group vs Mock group, P<0.001; R group vs Mock group, P<0.001; R group vs ROS group, P=0.013; RB group vs Mock group, P<0.001; RB group vs ROS group, P<0.001; RB group vs R group, P=0.002). Expression level of P62 in the RB group was significantly lower than that in the R group and ROS group (ROS group vs Mock group, P<0.001; R group vs Mock group, P<0.001; R group vs ROS group, P=0.863; RB group vs Mock group, P=0.081; RB group vs ROS group, P<0.001; RB group vs R group, P<0.001). $ P<0.05 vs the Mock group, * P<0.05 vs the ROS group, # P<0.05 vs the R group. (B) Western blot of LC-3, FTH1, NCOA4 and P62 in liver tissues of different groups. Expression level of LC-3-II in the BP group was significantly lower than that in the SCS group (SCS group vs Normal group, P<0.001; P group vs Normal group, P=0.017; P group vs SCS group, P<0.001; BP group vs Normal group, P=0.124; BP group vs SCS group, P<0.001; BP group vs P group, P=0.172). Expression level of FTH1 in the BP group was significantly higher than that in the P group and SCS group (SCS group vs Normal group, P=0.602; P group vs Normal group, P<0.001; P group vs SCS group, P<0.001; BP group vs Normal group, P<0.001; BP group vs SCS group, P<0.001; BP group vs P group, P=0.001). Expression level of NCOA4 in the BP group was significantly higher than that in the SCS group (SCS group vs Normal group, P<0.001; P group vs Normal group, P<0.001; P group vs SCS group, P=0.054; BP group vs Normal group, P<0.001; BP group vs SCS group, P=0.004; BP group vs P group, P=0.055). Expression level of P62 in the BP group was significantly higher than that in the P group and SCS group (SCS group vs Normal group, P<0.001; P group vs Normal group, P<0.001; P group vs SCS group, P=0.005; BP group vs Normal group, P=0.062; BP group vs SCS group, P<0.001; BP group vs P group, P<0.001). $ P<0.05 vs the Normal group, * P<0.05 vs the SCS group, # P<0.05 vs the P group. SCS – static cold storage; P – NMP; BP – BMMSCs combined with NMP; NMP – normothermic machine perfusion; BMMSCs – bone marrow mesenchymal stem cells; ROS – reactive oxygen species; LC-3 – light Chain 3; FTH1 – ferritin heavy chain; NCOA4 – nuclear receptor co-activator 4; P62 – sequestosome 1/p62.
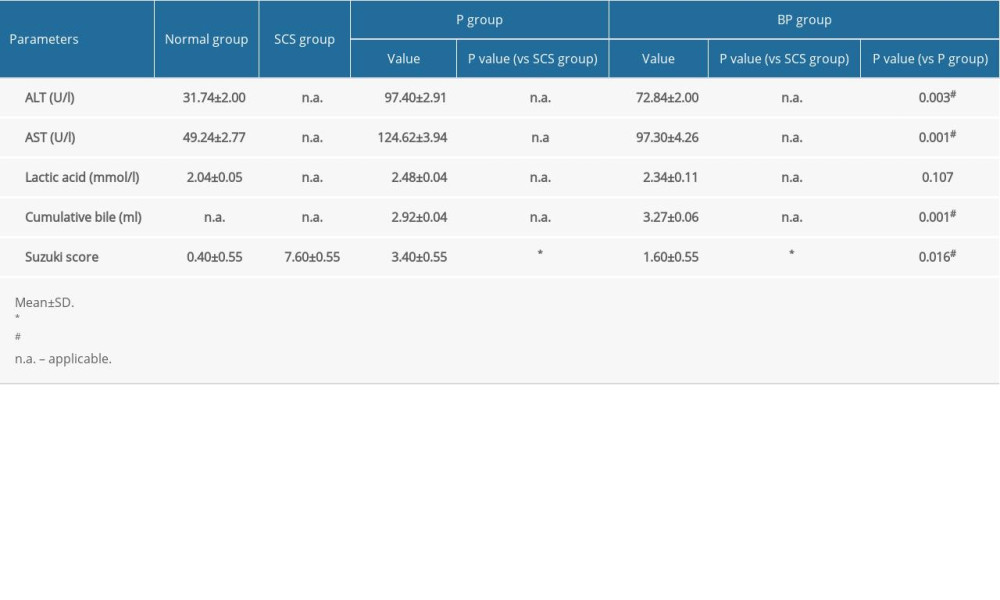
References
1. Peralta C, Jimenez-Castro MB, Garcia-Sancho J, Hepatic ischemia and reperfusion injury: Effects on the liver sinusoidal milieu: J Hepatol, 2013; 59; 1094-106
2. Melser S, Lavie J, Benard G, Mitochondrial degradation and energy metabolism: Biochim Biophys Acta, 2015; 1853; 2812-21
3. Choi EK, Jung H, Kim K, Sodium nitrite attenuates hepatic ischemia-reperfusion injury in rats: Exp Clin Transplant, 2019; 17; 348-54
4. Angelico R, Perera M, Manzia TM, Donation after circulatory death in paediatric liver transplantation: Current status and future perspectives in the machine perfusion era: Biomed Res Int, 2018; 2018 1756069
5. DeOliveira ML, Jassem W, Valente R, Biliary complications after liver transplantation using grafts from donors after cardiac death: results from a matched control study in a single large volume center: Ann Surg, 2011; 254; 716-22 discussion 722–23
6. Detelich D, Markmann JF, Normothermic liver preservation, current status and future directions: Curr Opin Organ Transplant, 2018; 23; 347-52
7. Winterbourn CC, Kettle AJ, Hampton MB, Reactive oxygen species and neutrophil function: Annu Rev Biochem, 2016; 85; 765-92
8. Över SB, Güven C, Taskin E, Sevgiler Y, Oxidative and apoptotic effects of fluoxetine and its metabolite norfluoxetine in Daphnia magna: Arch Hig Rada Toxicol, 2020; 71; 211-22
9. Yamada N, Karasawa T, Wakiya T, Iron overload as a risk factor for hepatic ischemia reperfusion injury in liver transplantation: Potential role of ferroptosis: Am J Transplant, 2020; 20; 1606-18
10. Chouchani ET, Pell VR, Gaude E, Ischaemic accumulation of succinate controls reperfusion injury through mitochondrial ROS: Nature, 2014; 515; 431-35
11. Ravikumar R, Jassem W, Mergental H, Liver Transplantation after ex vivo normothermic machine preservation: A phase 1 (first-in-man) clinical trial: Am J Transplant, 2016; 16; 1779-87
12. Watson C, Kosmoliaptsis V, Randle LV, Normothermic perfusion in the assessment and preservation of declined livers before transplantation: Hyperoxia and vasoplegia-important lessons from the first 12 cases: Transplantation, 2017; 101; 1084-98
13. Oliveira T, Marques PE, Proost P, Teixeira M, Neutrophils: A cornerstone of liver ischemia and reperfusion injury: Lab Invest, 2018; 98; 51-62
14. Schlegel A, Kron P, Graf R, Warm vs cold perfusion techniques to rescue rodent liver grafts: J Hepatol, 2014; 61; 1267-75
15. Op DDS, Karimian N, Sutton ME, Ex vivo normothermic machine perfusion and viability testing of discarded human donor livers: Am J Transplant, 2013; 13; 1327-35
16. Liu Y, Xu Z, Jin T, Ferroptosis in low-grade glioma: A new marker for diagnosis and prognosis: Med Sci Monit, 2020; 26; e921947
17. Zheng P, Hu X, Lou Y, Tang K, A rabbit model of osteochondral regeneration using three-dimensional printed polycaprolactone-hydroxyapatite scaffolds coated with umbilical cord blood mesenchymal stem cells and chondrocytes: Med Sci Monit, 2019; 25; 7361-69
18. Yang L, Cao H, Sun D, Normothermic machine perfusion combined with bone marrow mesenchymal stem cells improves the oxidative stress response and mitochondrial function in rat donation after circulatory death livers: Stem Cells Dev, 2020; 29; 835-52
19. Yang L, Cao H, Sun D, Bone marrow mesenchymal stem cells combine with normothermic machine perfusion to improve rat donor liver quality – the important role of hepatic microcirculation in donation after circulatory death: Cell Tissue Res, 2020; 381; 239-54
20. Cao H, Yang L, Hou B, Heme oxygenase-1-modified bone marrow mesenchymal stem cells combined with normothermic machine perfusion to protect donation after circulatory death liver grafts: Stem Cell Res Ther, 2020; 11; 218
21. Salama NM, Zaghlol SS, Mohamed HH, Kamar SS, Suppression of the inflammation and fibrosis in Asherman syndrome rat model by mesenchymal stem cells: Histological and immunohistochemical studies: Folia Histochem Cytobiol, 2020; 58; 208-18
22. Yang L, Shen ZY, Wang RR, Effects of heme oxygenase-1-modified bone marrow mesenchymal stem cells on microcirculation and energy metabolism following liver transplantation: World J Gastroenterol, 2017; 23; 3449-67
23. Suzuki S, Toledo-Pereyra LH, Rodriguez FJ, Cejalvo D, Neutrophil infiltration as an important factor in liver ischemia and reperfusion injury. Modulating effects of FK506 and cyclosporine: Transplantation, 1993; 55; 1265-72
24. Yin ML, Song HL, Yang Y, Effect of CXCR3/HO-1 genes modified bone marrow mesenchymal stem cells on small bowel transplant rejection: World J Gastroenterol, 2017; 23; 4016-38
25. Sun D, Yang L, Cao H, Study of the protective effect on damaged intestinal epithelial cells of rat multilineage-differentiating stress-enduring (Muse) cells: Cell Biol Int, 2020; 44; 549-59
26. Detelich D, Markmann JF, The dawn of liver perfusion machines: Curr Opin Organ Transplant, 2018; 23; 151-61
27. Yang L, Cao H, Sun D, Normothermic machine perfusion combined with bone marrow mesenchymal stem cells improves the oxidative stress response and mitochondrial function in rat donation after circulatory death livers: Stem Cells Dev, 2020; 29; 835-52
28. Wu B, Song HL, Yang Y, Improvement of liver transplantation outcome by heme oxygenase-1-transduced bone marrow mesenchymal stem cells in rats: Stem Cells Int, 2016; 2016 9235073
29. Yin M, Shen Z, Yang L, Protective effects of CXCR3/HO1 gene modified BMMSCs on damaged intestinal epithelial cells: Role of the p38MAPK signaling pathway: Int J Mol Med, 2019; 43; 2086-102
30. Saidi RF, Kenari SK, Liver ischemia/reperfusion injury: An overview: J Invest Surg, 2014; 27; 366-79
31. Fernandez L, Carrasco-Chaumel E, Serafin A, Is ischemic preconditioning a useful strategy in steatotic liver transplantation?: Am J Transplant, 2004; 4; 888-99
32. Su JP, Sam SC, Kyu MK, Protective effect of sestrin2 against iron overload and ferroptosis-induced liver injury: Toxicol Appl Pharmacol, 2019; 379; 114665
33. Frijhoff J, Winyard PG, Zarkovic N, Clinical relevance of biomarkers of oxidative stress: Antioxid Redox Signal, 2015; 23; 1144-70
34. Taskin E, Guven C, Sahin L, Dursun N, The cooperative effect of local angiotensin-II in liver with adriamycin hepatotoxicity on mitochondria: Med Sci Monit, 2016; 22; 1013-21
35. Schlegel A, Muller X, Dutkowski P, Hypothermic machine preservation of the liver: State of the art: Curr Transplant Rep, 2018; 5; 93-102
36. Ma Y, Li J, Metabolic shifts during aging and pathology: Compr Physiol, 2015; 5; 667-86
37. Liang S, Sun C, Yang P, Core-shell structured up conversion nanocrystal-dendrimer composite as a carrier for mitochondria targeting and catalase enhanced anti-cancer photodynamic therapy: Biomaterials, 2020; 240; 119850
38. Gao Y, Sun J, Dong C, Extracellular vesicles derived from adipose mesenchymal stem cells alleviate PM2.5-induced lung injury and pulmonary fibrosis: Med Sci Monit, 2020; 26; e922782
39. Mizushima N, Komatsu M, Autophagy: Renovation of cells and tissues: Cell, 2011; 147; 728-41
40. Mancias JD, Wang X, Gygi SP, Quantitative proteomics identifies NCOA4 as the cargo receptor mediating ferritinophagy: Nature, 2014; 509; 105-9
41. Zhang Z, Guo M, Li Y, RNA-binding protein ZFP36/TTP protects against ferroptosis by regulating autophagy signaling pathway in hepatic stellate cells: Autophagy, 2020; 16; 1482-505
42. Tang M, Chen Z, Wu D, Chen L, Ferritinophagy/ferroptosis: Iron-related newcomers in human diseases: J Cell Physiol, 2018; 233; 9179-90
43. Kong Z, Liu R, Cheng Y, Artesunate alleviates liver fibrosis by regulating ferroptosis signaling pathway: Biomed Pharmacother, 2019; 109; 2043-53
Figures
Figure 1. Schematic diagram of the NMP system. The NMP system is a single-cycle system that mainly includes centrifugal pumps, membrane oxygenators, organ chambers, heaters, and pressure and temperature monitors. NMP – normothermic machine perfusion.Figure 2. Evaluation of the NMP system and BMMSCs. (A) Morphology characteristics of third-generation BMMSCs; (B) Adipogenic induction; (C) Osteogenic induction; (D) Bright-field image of GFP-BMMSCs; (E) Fluorescent image of GFP-BMMSCs showing that >85% of the cells are transduced with GFP; (F) Fluorescent image of DCD donor liver perfused by BMMSCs combined with NMP at 6 h, the arrow indicates GFP-BMMSCs colonized in hepatic sinusoids. BMMSCs – bone marrow mesenchymal stem cells; GFP – green fluorescent protein; NMP – normothermic machine perfusion.Figure 3. Quality of DCD donor livers ameliorated by BMMSCs combined with NMP. (A) Gross appearance of DCD donor livers; (B) Histopathological change of DCD donor livers. I: warm ischemia at 30 min; II: 6 h in the SCS group; III: 6 h in the P group; IV: 6 h in the BP group. BMMSCs – bone marrow mesenchymal stem cells; P – NMP; BP – NMP combined with BMMSCs; NMP – normothermic machine perfusion; SCS – static cold storage.Figure 4. Oxidative stress and ferroptosis of DCD donor liver alleviated by BMMSCs. (A) IF of GPX4 and PTGS2 in hepatic tissues of different groups. GPX4 is shown in green, PTGS2 is shown in red, and the DAPI-stained nuclei are shown in blue. (B) Western blot of GPX4 and PTGS2 in hepatic tissues of different groups. The expression levels of GPX4 in the BP group were significantly higher than those in the P group (P=0.004) and SCS group (P<0.001). The expression levels of PTGS2 in the BP group were significantly lower than those in the P group (P=0.002) and SCS group (P<0.001). (C) MDA in hepatic tissues of different groups (P group vs SCS group, P<0.001; BP group vs SCS group, P<0.001; BP group vs P group, P=0.001). (D) GSH in hepatic tissues of different groups (P group vs SCS group, P 0.001; BP group vs SCS group, P<0.001; BP group vs P group, P=0.132). (E) The levels of Fe2+ release in different groups, which were significantly lower in the P and BP groups than those in the SCS group (P group vs SCS group, P<0.001; BP group vs SCS group, P<0.001; BP group vs P group, P=0.020). (F) The ultrastructure of hepatic tissues in different groups. The mitochondria of hepatocytes in SCS group showed severe edema and vacuolar degeneration, with irreversibly damaged mitochondria, partial mitochondrial necrosis and lysis (shown in white arrow), and disordered mitochondrial crest structure, which mostly disappeared. The mitochondria in the BP group and P group showed almost no swelling or vacuole degeneration, with intact mitochondrial crest structure and less irreversible mitochondrial damage. * P<0.05 vs the SCS group, # P<0.05 vs the P group. DCD – donation after circulatory death; SCS – static cold storage; P – NMP; BP – BMMSCs combined with NMP; NMP – normothermic machine perfusion; BMMSCs – bone marrow mesenchymal stem cells.Figure 5. Alleviated hydrogen peroxide-induced ferroptosis in IAR-20 cells co-cultured with BMMSCs. (A) Relative vitality of IAR-20 cells in different groups, which was significantly higher in the R group and RB group than that in the ROS group (R group vs ROS group, P=0.035; RB group vs ROS group, P<0.001; RB group vs R group, P<0.001). (B) Intracellular concentrations of free Fe2+ in IAR-20 cells of different groups, which were significantly lower in the R group and RB group than that in the ROS group (R group vs ROS group, P=0.010; RB group vs ROS group, P<0.001; RB group vs R group, P=0.003). (C, D) Intracellular concentrations of ROS (graded by the fluorescent intensity) in IAR-20 cells of different groups, which were significantly lower in the R group and RB group than that in the ROS group (R group vs ROS group, P=0.036; RB group vs ROS group, P<0.001; RB group vs R group, P=0.002). (E) Western blot of GPX4 and PTGS2 in IAR-20 cells of different groups. The expression levels of GPX4 in the RB group were significantly higher than those in the R group and ROS group (R group vs ROS group, P=0.001; RB group vs ROS group, P<0.001; RB group vs R group, P=0.011). The expression levels of PTGS2 in the RB group were significantly lower than those in the R group and ROS group (R group vs ROS group, P=0.002; RB group vs ROS group, P<0.001; RB group vs R group, P=0.005). (F) The ultrastructure of IAR-20 cells in different groups. The Mock group showed intact cellular morphology, with normal mitochondrial structure. The ROS group showed destroyed intracellular mitochondria, with twisted and broken cell ridges, and a large number of autophagy vacuoles in the cytoplasm. Morphology of the IAR-20 cells in the RB group was significantly better than that of the R group and ROS group, with significant fewer intracellular autophagy vacuoles and better mitochondrial morphology. * P<0.05 vs the ROS group, # P<0.05 vs the R group. Mock group – normal IAR-20cells; ROS group – hydrogen peroxide-induced injury at 45 min; R group – recovered by resuming normal culture for 6 h after injury; RB group – recovered by resuming normal culture and co-cultured with BMMSCs for 6 h after injury. ROS – reactive oxygen species; GPX4 – glutathione peroxidase 4; PTGS2 – prostaglandin-endoperoxide synthase 2; FITC – fluorescein isothiocyanate isomer.Figure 6. Decreased autophagy and increased expression of ferritinophagy-related proteins in IAR-20 cells co-cultured with BMMSCs. (A) Western blot of LC-3, FTH1, NCOA4 and P62 in IAR-20 cells of different groups. Expression level of LC-3-II in the RB group was significantly lower than that in the R group and ROS group (ROS group vs Mock group, P<0.001; R group vs Mock group, P<0.001; R group vs ROS group, P=0.005; RB group vs Mock group, P<0.001; RB group vs ROS group, P<0.001; RB group vs R group, P=0.001). Expression level of FTH1 in the RB group was significantly higher than that in the R group and ROS group (ROS group vs Mock group, P=0.040; R group vs Mock group, P=0.014; R group vs ROS group, P=0.003; RB group vs Mock group, P=0.003; RB group vs ROS group, P=0.002; RB group vs R group, P=0.005). Expression level of NCOA4 in the RB group was significantly lower than that in the R group and ROS group (ROS group vs Mock group, P<0.001; R group vs Mock group, P<0.001; R group vs ROS group, P=0.013; RB group vs Mock group, P<0.001; RB group vs ROS group, P<0.001; RB group vs R group, P=0.002). Expression level of P62 in the RB group was significantly lower than that in the R group and ROS group (ROS group vs Mock group, P<0.001; R group vs Mock group, P<0.001; R group vs ROS group, P=0.863; RB group vs Mock group, P=0.081; RB group vs ROS group, P<0.001; RB group vs R group, P<0.001). $ P<0.05 vs the Mock group, * P<0.05 vs the ROS group, # P<0.05 vs the R group. (B) Western blot of LC-3, FTH1, NCOA4 and P62 in liver tissues of different groups. Expression level of LC-3-II in the BP group was significantly lower than that in the SCS group (SCS group vs Normal group, P<0.001; P group vs Normal group, P=0.017; P group vs SCS group, P<0.001; BP group vs Normal group, P=0.124; BP group vs SCS group, P<0.001; BP group vs P group, P=0.172). Expression level of FTH1 in the BP group was significantly higher than that in the P group and SCS group (SCS group vs Normal group, P=0.602; P group vs Normal group, P<0.001; P group vs SCS group, P<0.001; BP group vs Normal group, P<0.001; BP group vs SCS group, P<0.001; BP group vs P group, P=0.001). Expression level of NCOA4 in the BP group was significantly higher than that in the SCS group (SCS group vs Normal group, P<0.001; P group vs Normal group, P<0.001; P group vs SCS group, P=0.054; BP group vs Normal group, P<0.001; BP group vs SCS group, P=0.004; BP group vs P group, P=0.055). Expression level of P62 in the BP group was significantly higher than that in the P group and SCS group (SCS group vs Normal group, P<0.001; P group vs Normal group, P<0.001; P group vs SCS group, P=0.005; BP group vs Normal group, P=0.062; BP group vs SCS group, P<0.001; BP group vs P group, P<0.001). $ P<0.05 vs the Normal group, * P<0.05 vs the SCS group, # P<0.05 vs the P group. SCS – static cold storage; P – NMP; BP – BMMSCs combined with NMP; NMP – normothermic machine perfusion; BMMSCs – bone marrow mesenchymal stem cells; ROS – reactive oxygen species; LC-3 – light Chain 3; FTH1 – ferritin heavy chain; NCOA4 – nuclear receptor co-activator 4; P62 – sequestosome 1/p62. In Press
05 Mar 2024 : Clinical Research
Role of Critical Shoulder Angle in Degenerative Type Rotator Cuff Tears: A Turkish Cohort StudyMed Sci Monit In Press; DOI: 10.12659/MSM.943703
06 Mar 2024 : Clinical Research
Comparison of Outcomes between Single-Level and Double-Level Corpectomy in Thoracolumbar Reconstruction: A ...Med Sci Monit In Press; DOI: 10.12659/MSM.943797
21 Mar 2024 : Meta-Analysis
Economic Evaluation of COVID-19 Screening Tests and Surveillance Strategies in Low-Income, Middle-Income, a...Med Sci Monit In Press; DOI: 10.12659/MSM.943863
10 Apr 2024 : Clinical Research
Predicting Acute Cardiovascular Complications in COVID-19: Insights from a Specialized Cardiac Referral Dep...Med Sci Monit In Press; DOI: 10.12659/MSM.942612
Most Viewed Current Articles
17 Jan 2024 : Review article
Vaccination Guidelines for Pregnant Women: Addressing COVID-19 and the Omicron VariantDOI :10.12659/MSM.942799
Med Sci Monit 2024; 30:e942799
14 Dec 2022 : Clinical Research
Prevalence and Variability of Allergen-Specific Immunoglobulin E in Patients with Elevated Tryptase LevelsDOI :10.12659/MSM.937990
Med Sci Monit 2022; 28:e937990
16 May 2023 : Clinical Research
Electrophysiological Testing for an Auditory Processing Disorder and Reading Performance in 54 School Stude...DOI :10.12659/MSM.940387
Med Sci Monit 2023; 29:e940387
01 Jan 2022 : Editorial
Editorial: Current Status of Oral Antiviral Drug Treatments for SARS-CoV-2 Infection in Non-Hospitalized Pa...DOI :10.12659/MSM.935952
Med Sci Monit 2022; 28:e935952