16 June 2021: Review Articles
Current Applications and Selected Technical Details of Dual-Energy X-Ray Absorptiometry
Piotr Sawicki1ABCDEF*, Marek Tałałaj2D, Katarzyna Życińska13DEG, Wojciech S. Zgliczyński4DFG, Waldemar Wierzba56DEFGDOI: 10.12659/MSM.930839
Med Sci Monit 2021; 27:e930839


Abstract
ABSTRACT: The application of dual-energy X-ray absorptiometry (DXA) examinations in the assessment of bone mineral density (BMD) in the lumbar spine, hip, and forearm is the basic diagnostic method for recognition of osteoporosis. The constant development of DXA technique is due to the aging of societies and the increasing importance of osteoporosis as a public health problem. In order to assess the degree of bone demineralization in patients with hyperparathyroidism, forearm DXA examination is recommended. The vertebral fracture assessment (VFA) of the thoracic and lumbar spine, performed by a highly-skilled technician, is an interesting alternative to the X-ray examination. The DXA total body examination can be useful in the evaluation of fat redistribution among patients after bariatric surgery, in patients infected with HIV and receiving antiretroviral therapy, and in patients with metabolic diseases and suspected to have sarcopenia. The assessment of visceral adipose tissue (VAT) and detection of abdominal aortic calcifications may be useful in the prediction of cardiovascular events. The positive effect of anti-resorptive therapy may affect some parameters of DXA hip structure analysis (HSA). Long-term anti-resorptive therapy, especially with the use of bisphosphonates, may result in changes in the DXA image, which may herald atypical femur fractures (AFF). Reduction of the periprosthetic BMD in the DXA measurements can be used to estimate the likelihood of loosening the prosthesis and periprosthetic fractures. The present review aims to present current applications and selected technical details of DXA.
Keywords: Absorptiometry, Photon, Bone Density, Diagnostic Imaging, Osteoporosis, Bone Diseases, Metabolic, Osteoporosis, Postmenopausal, Radiography, Spinal Fractures
Background
Dual-energy X-ray absorptiometry (DXA) is currently a primary radiological technique in the diagnosis of osteoporosis, used for stratifying the risk of osteoporotic fractures by assessing bone mineral density (BMD) [1,2]. The introduction of DXA scanners in 1987 to clinical practice was a milestone that allowed the precise diagnosis of osteoporosis [2,3]. According to the first publication showing the effectiveness of bisphosphonates in the treatment of bone loss [4], DXA contributed to the management of osteoporotic patients. The introduction of fan beam radiation source technology in 1993 allowed shortening the radiation exposure time while improving the quality of the images received [5]. Based on the BMD measurements, the T-score and Z-score parameters were defined. T-score is the difference between measured BMD and young adult mean BMD (specific for gender and ethnic group) in relation to the young adult population standard deviation (SD). Z-score is the difference between measured BMD and age-matched mean BMD (specific for gender and ethnic group) in relation to age-matched population SD [2]. The improvement of the quality of the obtained images enabled application of the DXA technique in the diagnosis of vertebral compression fractures using a vertebral fracture assessment (VFA) tool, and the introduction of high-resolution VFA imaging allowed for the assessment of calcifications in the abdominal aorta [6]. The development of fan-shaped beam densitometers (associated with multiple detectors), in contrast to pencil densitometers (emitting a single rectilinear highly collimated beam of X-rays associated with a single detector), allowed fast DXA body composition assessment comprising bone mineral content (BMC), fat mass, and lean mass [7]. New types of DXA examinations, such as hip structure analysis, finite element analysis, detection of atypical femur fractures, or the periprosthetic DXA, outline new directions of the DXA development and are currently under clinical trials. The present review aims to present current applications and selected technical details of the DXA examinations.
Importance of the DXA in Diagnostics of BMD
The basic function of DXA remains the assessment of BMD, used to recognize and follow up on the effects of osteoporosis treatment. Diagnosis of osteoporosis is based on the WHO criteria of osteoporosis and osteopenia [1]:
The T-score value is not validated for premenopausal women, men under 50 years of age, and for children. For these groups of patients, the Z-score parameter is more appropriate [2]. A Z-score equal to or less than −2.0 means “low bone density for chronologic age” [8].
The DXA diagnosis of osteoporosis is based on the assessment of the T-score of vertebrae L1–L4 in the lumbar spine (Figure 1), the T-score of the femoral neck and total proximal femur (Figure 2), as well as the T-score of the nondominant forearm (Figure 3) [9,10]. According to the guidelines of the National Osteoporosis Foundation, the worst result should be chosen [11].
To correctly perform the DXA examination of the lumbar spine, the patient should be supine in the center of the device and have lower limbs bent at a right angle in the hip and knee joints, supported by a positioner. The positioner ensures maximum flattening of the lumbar lordosis and the parallel position of the long axis of the lumbar spine in relation to the table of the device. After the examination, it should be checked whether the image of the lumbar spine is centered with sufficient airspace (equal on both sides of the lumbar spine), the spine is not rotated, the software correctly marked the boundaries of the vertebral bodies (in Figure 1 these are yellow curved lines at the borders of the vertebral bodies), and correctly separated the individual vertebral bodies from each other (in Figure 1 these are yellow straight lines between the vertebral bodies). Errors of these operations made by the software must be corrected manually.
If the T-score of the adjacent vertebrae differ by a value greater than 1.0 or in the presence of aortic calcifications and foreign bodies inside the vertebrae, such as cement or metal buttons, it is recommended to exclude a vertebra with a higher T-score from the analysis. The presence of radiation-absorbing contrast from previous radiological examinations in the examined area may disturb the assessment of BMD. The interval between radiological examination with contrast and densitometry depends on the marker used and its elimination time from the body, especially from the examined area. The lumbar spine DXA examination should start at the borderline L5/S1 to provide the correct identification of individual vertebrae and repeatability of examinations in subsequent years. An important problem may be the presence of the so-called “transitional vertebra”, found on average in 14.7% of the population [12], more often in men (28.1% vs 11.1% in men vs women, respectively) [13]. Degenerative changes due to their structure, and often due to the presence of calcifications, are characterized by much higher density and overstate the average mineral density of the vertebrae and should be removed manually by a technician from the analyzed region of interest (ROI). Otherwise, an overestimated T-score for the L1–L4 vertebrae of the lumbar spine may exclude patients from anti-resorptive therapy who in fact meet the DXA criteria for osteoporosis. The lumbar spine BMD is rarely underestimated, usually in patients after neurosurgical and orthopedic spine procedures (without the use of stabilizing materials) and in the presence of lytic neoplastic lesions in the vertebral bodies [14]. The problems described above result in incorrect estimation of BMD and they are diagnostic pitfalls of the lumbar spine DXA examination.
DXA examination of the proximal femur, similar to the examination of the lumbar spine, is performed in the supine position, but with lower limbs straightened and turned inwards to leave the smaller trochanter just visible. The image of a correctly performed examination should show the femoral neck, ischial bone, and greater trochanter. At least 3 cm of soft tissue should be visible below the ischial bone and above the greater trochanter. Before the analysis of the result, the physician should remember these principles and also should verify that the image is centered and does not contain foreign bodies and that the software correctly identified the bone tissue boundaries, the location of the midline, and the ROI of the femoral neck (Figure 2). Otherwise, the estimation of the BMD value will be incorrect, which is an important diagnostic pitfall.
DXA examination of forearm is a useful diagnostic tool [15], especially if it is difficult to interpret results of the lumbar spine or hip examinations, most often due to bilateral endoprostheses or obesity. This examination is also recommended in assessing bone decalcification among patients with hyperparathyroidism. Modern densitometers have standardized ROI for analysis and the measurements of BMD between the middle and distal 1/3 of the radial bone, which is considered reliable and diagnostic (Figure 3) [16,17]. Before the start of forearm examination, a patient should sit on a chair next to a table. The examined limb should be bent at the elbow, wrist placed in pronation on the table, and the hand clenched into a fist. The scan should start at the distal contact point between the radius and the ulna. The scan should show centered bones of the forearm with the visible distal epiphysis of the ulna (Figure 3).
Safety Considerations Regarding Radiation Dose
The radiation effective dose (RED) depends on the DXA scan modality used and takes the lowest values for the “fast-array” scan, intermediate values for the high-definition (HD) scan, and the highest values for the “array” scan [18]. RED is defined by the following values: 17.79–32.80 μSv for DXA examination of the lumbar spine, 5.29–9.55 μSv for DXA examination of the hip, less than 60 μSv for the VFA scan in the sagittal projection of the thoracolumbar spine, and 4–5 μSv for the body composition DXA scan performed with the latest-generation densitometers [7,18]. REDs used in DXA examinations are lower compared to the conventional radiographic examinations and are comparable to the background radiation [7,18]; therefore, the only contraindication to DXA examinations is pregnancy [19]. For comparison, the effective dose of a computed tomography of head is 2 mSv, which is equivalent to 8-month exposure to background radiation [7,20].
DXA Diagnosis of Vertebral Fractures Using VFA
The VFA tool allows diagnosis of osteoporotic fractures of vertebrae from Th4 to L4 by semi-automatic or manual assessment in the sagittal plane of 3 vertebral heights (anterior, medial, and posterior) and their percentage reduction (Figure 4). Mild fracture is recognized by a 20–25% reduction in vertebral height, moderate when the reduction is 26–40%, and severe when it exceeds 40% [21]. After analyzing vertebral heights, the software assigns the degree of fracture and its type (wedge, biconcave, or crush) to the vertebrae. The obtained results are presented as quantitative and semi-quantitative assessments (Figure 5).
The location of measurement points in a semi-automatic manner shows particular effectiveness in the assessment of healthy vertebrae and the diagnosis of benign fractures [22]. However, it is less effective for moderate and severe fractures. In this situation, the position of the measurement points must be corrected manually. It is often difficult to assess vertebrae above T7 [23] because of the projection of mediastinal structures on the vertebral bodies or the presence of calcifications in pulmonary circulation vessels. In these situations, and in the case of severe osteoarthritis and degenerative changes, VFA shows lower sensitivity and specificity compared to radiography [24]. The most important diagnostic pitfall in the VFA examination is the possibility of a false-positive or false-negative diagnosis of vertebral fracture due to the still limited resolution of VFA images and the situations described above, which impede the identification of the individual heights of vertebral bodies.
Important advantages of the VFA are quick assessment of vertebral morphology within 2 sections of the spine, the low cost of examination [25], and the ability to assess BMD in a single visit using the same device. In addition, the compatibility in the detection of vertebral fractures between traditional radiography and VFA encourages the use of VFA as a screening examination among patients with osteoporotic risk factors and for the prospective evaluation of treatment effectiveness [26]. Therefore, despite the fact that radiography is still the criterion standard for diagnosis of vertebral fractures [27], the field for the use of VFA is growing. As Korean researchers have shown [28], use of VFA as screening diagnostics of vertebral fractures [29], followed by conventional radiography, was characterized by the highest efficiency, the lowest cost, and the lowest radiation dose. However, the limitations of the VFA method should be considered, and it is important for any research center to validate the densitometer against conventional radiography of the spine [30].
Visualization of Abdominal Aortic Calcifications (AAC)
In addition to the standard VFA test, several models offer the high-definition VFA (HD VFA) examination. In addition to better resolution of images, HD VFA can be used to diagnose abdominal aortic calcifications by the AAC-8 visual scale. In addition to traditional risk factors for cardiovascular diseases, the presence of calcifications in the abdominal aorta can be associated with higher risk of myocardial infarction and stroke [31]. Predicting cardiovascular events based on AAC was demonstrated to benefit kidney transplant recipients [32]. Among patients with end-stage chronic kidney disease treated with peritoneal dialysis, the high AAC-8 calcification index is a strong predictor of mortality from any cause [33].
Evaluation of Hip Structure Analysis (HSA)
Measurements of the HSA parameters are performed automatically during the hip BMD examination. HSA involves the analysis of a number of parameters within 3 additional zones:
In each of these areas, the device measures analogous parameters [34]:
The last 2 parameters affect the shoulder moments of bending forces in the proximal femur [35].
Studies showed the correlation between the change in the values of individual parameters of the femoral neck geometry and the treatment, with significant changes observed primarily in 2 areas: NN and IT. In contrast, the FS area is least susceptible to fractures, as well as to the effects of drugs; therefore, it is often overlooked in studies [35]. Moving to the direct interaction of individual drugs (eg, teriparatide) increases CSA and SM and reduces BR. These changes are the largest in the NN area, less expressed in IT, and practically imperceptible in the FS. Therefore, teriparatide improves resistance to bending and axial forces and increases cortical bone thickness and stability of the neck and intertrochanter region. The effect of teriparatide on femoral geometry parameters is dose-dependent [36].
After 1 year of treatment, ibandronate used once a month in men increased cortical bone thickness and CSA and reduced BR in IT and FS. Interestingly, ibandronate did not significantly affect geometric parameters in the NN area [37]. A study comparing alendronate and risedronate used once a week in women with postmenopausal osteoporosis demonstrated an overall improvement in geometric parameters in each of the 3 main areas (NN, IT, FS), showing the advantage of alendronate over risedronate [38]. Analysis of 3-year use of denosumab among Japanese women with postmenopausal osteoporosis resulted in a significant increase in cortical bone thickness, CSA, CSMI, and SM and a decrease in BR in all 3 significant regions relative to placebo [39]. Moreover, patients who started receiving denosumab instead of placebo during the study had significant improvement of femoral geometry.
It is worth noting that despite the relatively low dose of radiation, measurements of femur geometry parameters are characterized by similar accuracy in both the densitometry and CT methods [40].
Diagnosis of Atypical Femur Fracture (AFF)
Atypical femur fractures are most often associated with long-term treatment with bisphosphonates; they often occur bilaterally and cause leg and groin pain [41]. The diagnosis of atypical femur fractures can be carried out during routine follow-up bone density testing [42].
Modern densitometers offer 2 technologies for AFF testing. The first is full-length femur imaging (FFI) using single-energy X-ray absorptiometry (SE). This examination has a significant advantage over the DXA technique because it guarantees an image resolution similar to X-ray and is 5 times faster than the DXA scan, lasting only 15 seconds, and covers the entire length of the shaft [43]. This is an important feature because atypical femur fractures can occur in any femoral region distal to the minor trochanter. The International Society of Clinical Densitometry indicates that it is appropriate to consider an FFI in patients with cumulative time of anti-resorptive therapy of over 3 years [44]. Radiological symptoms suggesting the possibility of atypical femoral fracture are periosteal local thickenings and cortical bumps along the lateral cortex [44]. These thickenings take the shape of a beak and are an expression of local bone formation and repair in response to cortical structure damage [45]. Another radiological symptom of atypical femoral fracture is the transverse radiopaque line, known in the literature as the “dreaded black line” [46]. Clinically, patients with AFF most often report thigh or groin pain, and these ailments precede the conversion to complete fracture by several weeks or even several months. Due to the much worse results of surgical treatment of atypical fractures [47], the diagnosis of clinical and radiological symptoms heralding the fracture may bring measurable benefits.
The second way to diagnose AFF is to extend the standard DXA scan to the entire femur. According to van de Laarschot et al [48], the positive predictive value of AFF diagnostics with DXA is 83.3%. Also, Ahlman et al [49] confirmed, despite the limitations described above, the usefulness of DXA for the diagnosis of AFF.
Evaluation of Finite Element Analysis (FEA)
A useful method of assessing bone strength and predicting fractures is finite element analysis (FEA). FEA is mathematical method describing reaction of bone structure to stress associated with loading. Several models to assess bone strength using FEA have been developed, for example:
Evaluation of FRAX
FRAX is a validated tool for the 10-year risk assessment of hip fracture and major osteoporotic fractures (forearm, proximal humerus, thoracic and lumbar vertebrae, hip) [60]. Modern densitometers display a survey with questions necessary to calculate FRAX. The software incorporates age, gender, height, weight, and ethnicity from data routinely entered prior to starting a hip DXA scan. The survey contains a series of questions that the patient should answer in order to calculate the FRAX value, such as: history of prior fractures in adult life (spontaneous or caused by low-energy trauma that does not result in a fracture in healthy people), history of hip fractures in parents, exposure to glucocorticoid therapy, diagnosis of rheumatoid arthritis, current smoking, and alcohol drinking. FRAX can be computed using BMI, without DXA examination and using BMD, with the T-score of the femoral neck [60]. FRAX is a strong, independent, additional risk factor for osteoporosis, but intervention thresholds vary considerably depending on the country and the guidelines of professional societies. It is possible to adjust the FRAX result by another, independent risk factor for osteoporosis, the trabecular bone score (TBS).
Definition and Importance of TBS
TBS is a parameter determining the microarchitecture of the trabecular bone, based on the texture (shade of gray) of the lumbar spine DXA image in the anterior-posterior projection [61]. It takes values from 0.5 to 2.0, and a higher index value is associated with less trabecular bone weaving damage and fracture. A result above 1.35 is considered as normal, a result lower than 1.20 indicates serious damage to the microstructure of the trabecular bone, and an intermediate result indicates partial damage [62]. TBS is not a direct marker of microarchitecture, but it reflects the number of trabeculae and their connections and divisions [63]. Knowing the TBS value, a modified FRAX can be obtained using special algorithms [64]. Previous studies demonstrated that the use of anti-resorptive treatment in postmenopausal women is associated with a significant increase in BMD and TBS in comparison to untreated patients [65]. An interesting application of TBS may be the assessment of fracture risk among patients with advanced osteoarthritis of the spine because it was proved that in the L4 vertebra (where degenerative changes are most severe) BMD measurement is significantly overstated in comparison to TBS measurement [62].
Body Composition Assessment
Although the diagnostic standard for assessing muscle mass remain computed tomography (CT) and magnetic resonance imaging (MRI) [66], a very valuable diagnostic option is DXA assessment of the body composition. The total body examination provides abundant information, such as calculations of the BMC, BMD, lean mass, and fat mass for the total body and in division into individual body regions (Figures 6, 7). The T-score and Z-score parameters are also calculated for the total body, but the T-score and Z-score for the entire skeleton cannot be used as the basis for the diagnosis of osteoporosis. The modern devices also calculate fat mass and total mass in android and gynoid areas with the ratio of android fat to gynoid fat (A/G), as well as mass, area, and volume of the visceral adipose tissue (VAT). The A/G ratio is strongly and positively correlated with glycated hemoglobin (HbA1c) and triglycerides (TG) and inversely related to HDL-C level [67]. DXA measurements of VAT are characterized by a sufficient level of precision [68] and are not inferior to CT and MRI examinations [69,70]. Excessive amounts of VAT in comparison to subcutaneous adipose tissue increases total mortality risk due to all causes in men [71]. In addition, increased VAT is associated with worse lipid, glycemic, hematocrit, and kidney profiles in the elderly [72].
Based on the assessment of the body fat mass, it was proven that higher fat mass reduces the overall risk of death in elderly women [73]. The total body examination can also be used to assess fat redistribution in patients infected with HIV and receiving antiretroviral therapy [74], as well as in patients with metabolic diseases [75] and anorexia [76]. It is a valuable tool for assessing the effectiveness of bariatric procedures [77]. The ASMM index (ASMMI), defined as appendicular skeletal muscle mass (ASMM, kg) per height squared (m2) [78] indicates low muscle mass if its value is below 7.0 kg/m2 for men and below 6.0 kg/m2 for women [79]. The result of ASMMI is available directly on the printout of the DXA examination of the body composition (Figure 7).
Evaluation of Periprosthetic DXA
DXA is the diagnostic standard in the assessment of periprosthetic BMD [80]. Current analysis approaches of periprosthetic BMD rely on the creation of ROI and calculating an average BMD value within them based on a pixel map [81,82]. The bone density analysis around the prosthesis can be carried out using 5 ROIs [83]. ROI subject to analysis should contain periprosthetic metaphyseal and diaphyseal bone around and away from the implant [84]. Validation of the current image processing techniques allowed development of a high spatial resolution tool for the assessment of periprosthetic BMD, called DXA region-free analysis [81,85]. Evaluation of the remodeled bone tissue around the prosthesis can provide useful information. The degree of BMD reduction in areas adjacent to the prosthesis can be used to estimate the likelihood of prosthesis loosening and periprosthetic fractures [86]. Distal femur BMD is about 10% lower in the leg after total knee arthroplasty and can be associated with increased periprosthetic fracture risk [87]. DXA is appropriate even for periprosthetic BMD measurement around the proximal component of total wrist arthroplasties [88].
Other Functions
Due to the low dose of radiation, DXA is also increasingly used in children; for example, to assess body fat [89]. Lumbar spine DXA examinations for infants and young children 0–5 years of age as well as total body DXA measurements for children >3 years of age have been approved by ISCD as being feasible and reproducible [84]. Based on DXA scans, it was proved that the BMD of premature newborns is lower compared to children born at term. Furthermore, the acceleration of bone mineralization in premature newborns allows achieving BMD values typical of term newborns after 6 months [90]. Based on the assessment of vitamin D serum concentration in pregnant women and neonatal BMD measurements, it was demonstrated that 25-hydroxyvitamin D deficiency in pregnancy results in reduced BMD and lower birth weight of newborns [91].
Conclusions
The basic and most important application of the DXA technique is the assessment of BMD with the calculation of the T-score, which is the only validated method of diagnosing osteoporosis. The constantly growing importance of DXA examinations and the development of new applications of this technique are associated with the increasing percentage of osteoporotic elderly people, the low radiation dose, and the possibility of performing additional DXA measurements with the assessment of BMD.
Figures
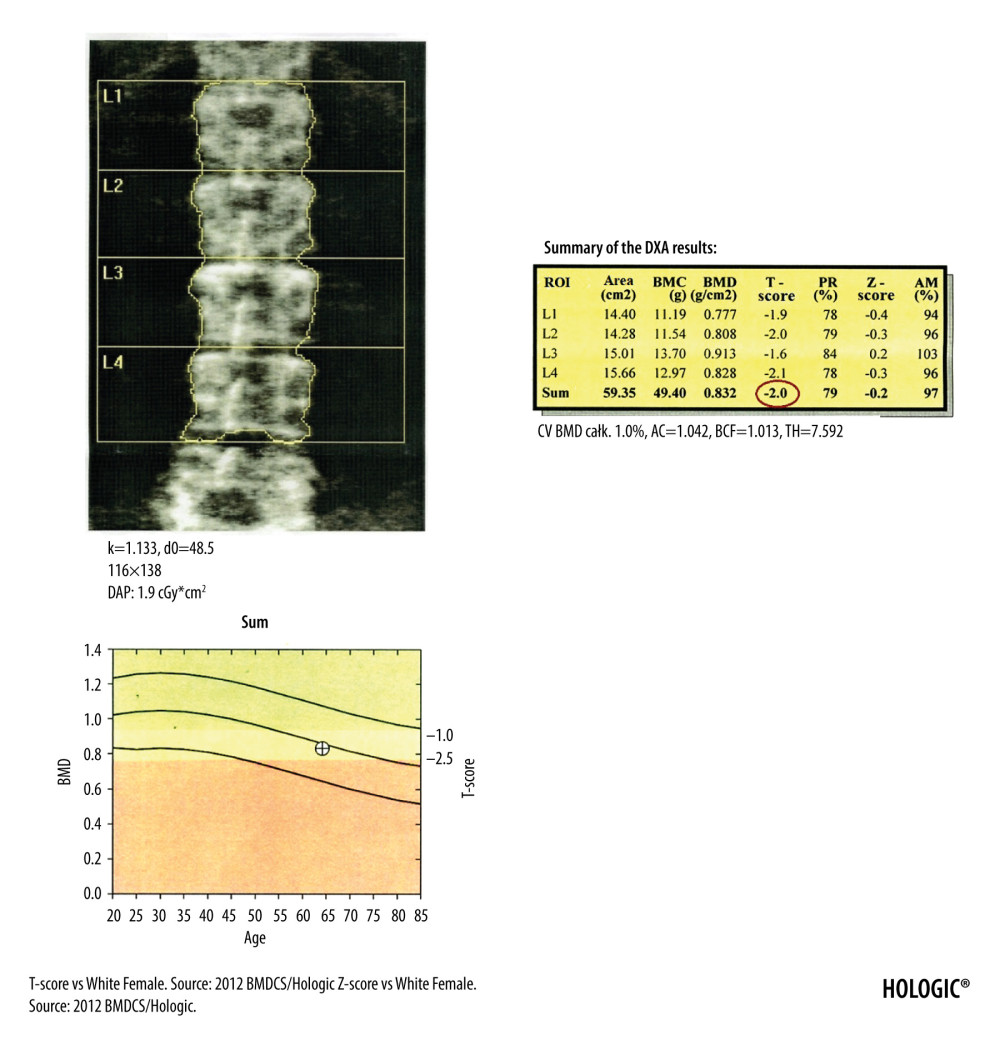 Figure 1. DXA examination of the lumbar spine. At the bottom of the picture is visible the borderline L5/S1, at the top the last pair of ribs connected to the Th12 vertebra. The presented image of the lumbar spine is not suitable for diagnostic objectives, but it is used to identify the ROI in the lumbar spine (vertebral bodies from L1 to L4). The diagnostic result is the T-score parameter estimated for the entire examined ROI area (circled in red). If, due to degenerative changes or artifacts, all 4 lumbar vertebrae cannot be used for analysis, 3 vertebrae should be used. The result of examination is reliable if at least 2 vertebrae are suitable for analysis.
 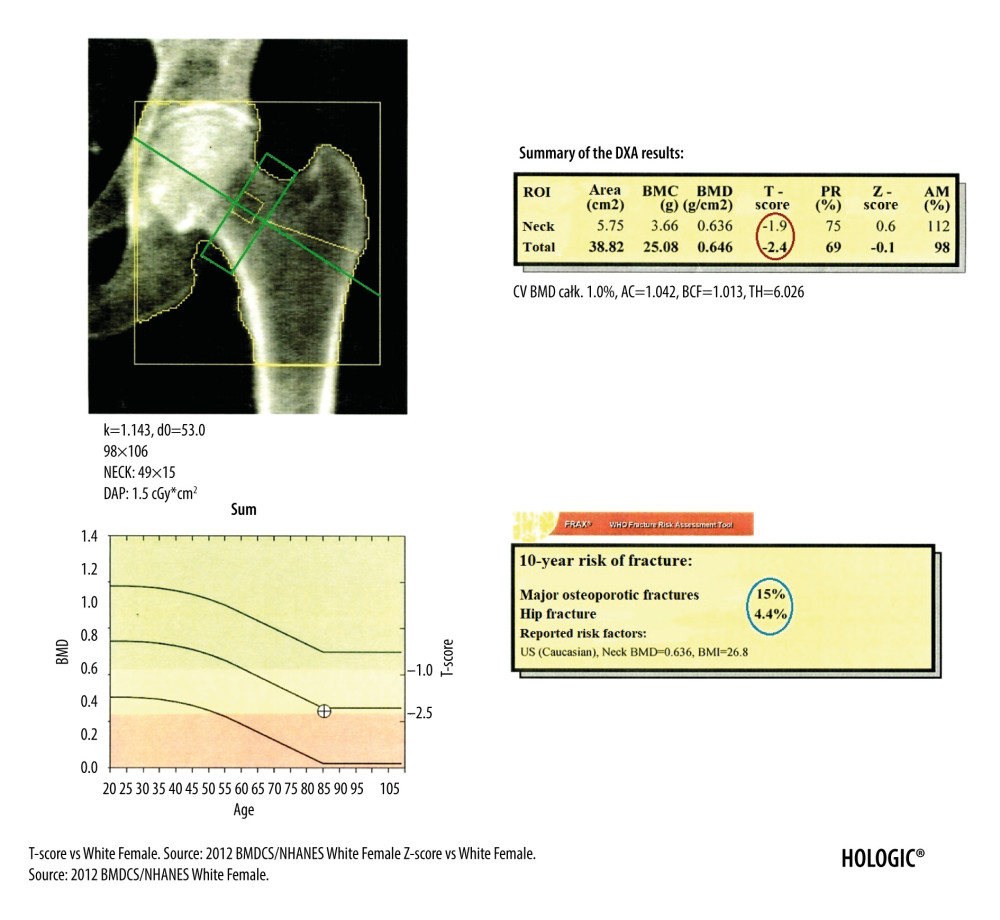 Figure 2. DXA examination of the hip. The diagnostic result is the T-score parameter estimated for the femoral neck (the upper value in the red circle) and for the total proximal femur (the lower value in the red circle). The ROI of the femoral neck (marked as green frame) should be perpendicular to the femoral neck, should not include the greater trochanter and the ischial bone, but should include soft tissues on both sides of the femoral neck. The midline (marked as green line) should cover the long axis of the femoral neck. In the blue circle is marked the FRAX for major osteoporotic fracture (upper value) and FRAX for hip fracture (lower value).
 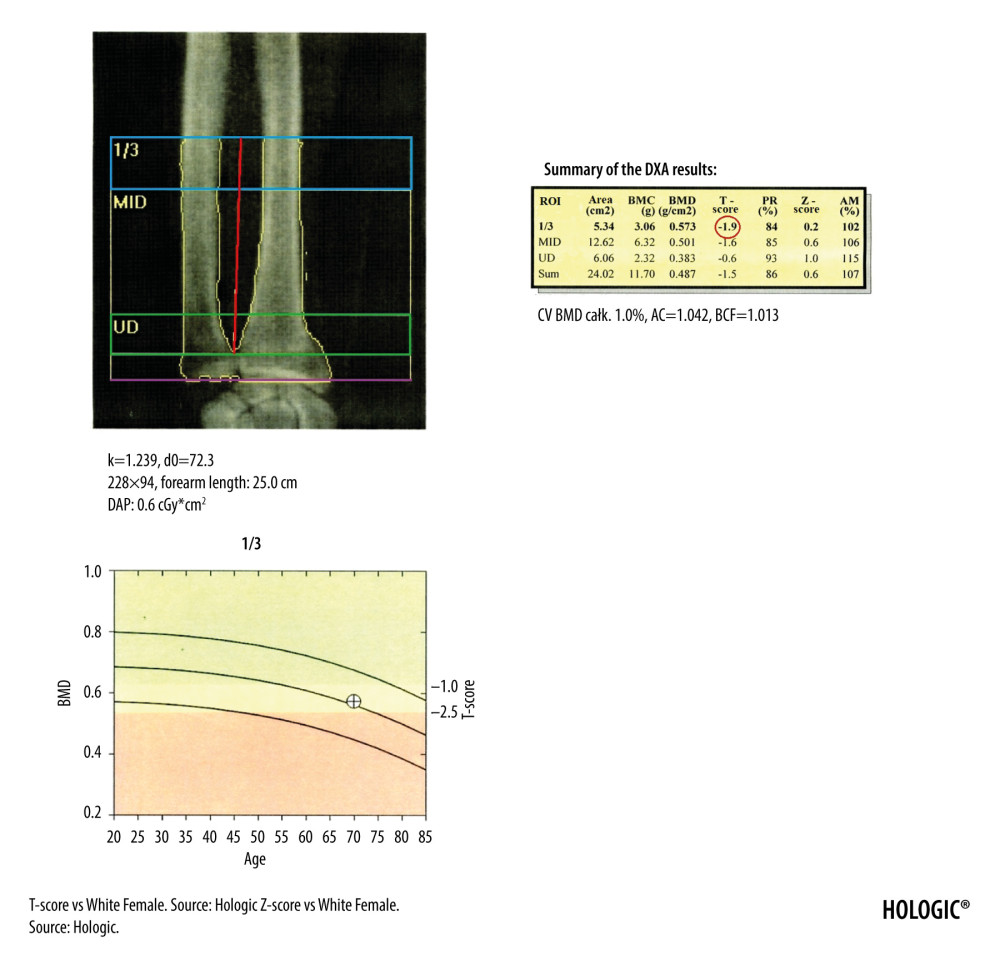 Figure 3. The DXA examination of the right forearm. The diagnostic result is the T-score parameter estimated for the 1/3 ROI of nondominant forearm (blue frame). The reference line (marked in purple) should be positioned at the distal end of the styloid process of the ulna, the radius plate should be located outside the ROI UD (green frame), and a vertical line crossing the middle of the 1/3, MID, and UD ROI (marked in red) should cut the airspace between the radius and ulna.
 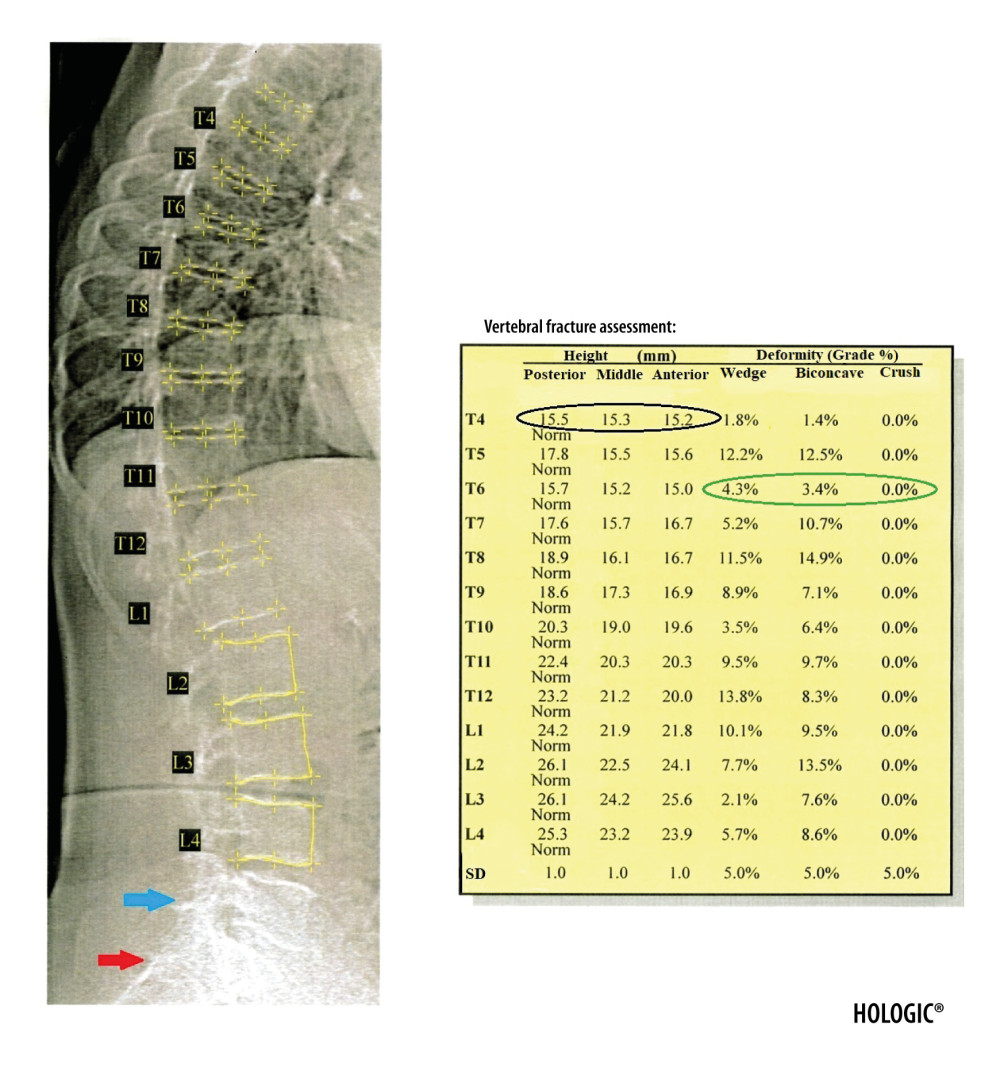 Figure 4. Result of the VFA examination in the thoracic and lumbar spine. The table shows individual vertebral heights in millimeters (marked in the black circle – the posterior, middle and anterior height, respectively, in order from the left) and the degree of deformation (%) of vertebral bodies (marked in the green circle – the wedge, biconcave and crush deformation, respectively, in order from the left). The red arrow indicates the position of the sacrum and the blue arrow the position of the L5 vertebra. Clear visualization of the sacrum and vertebra L5 is necessary for identification of examined vertebrae.
 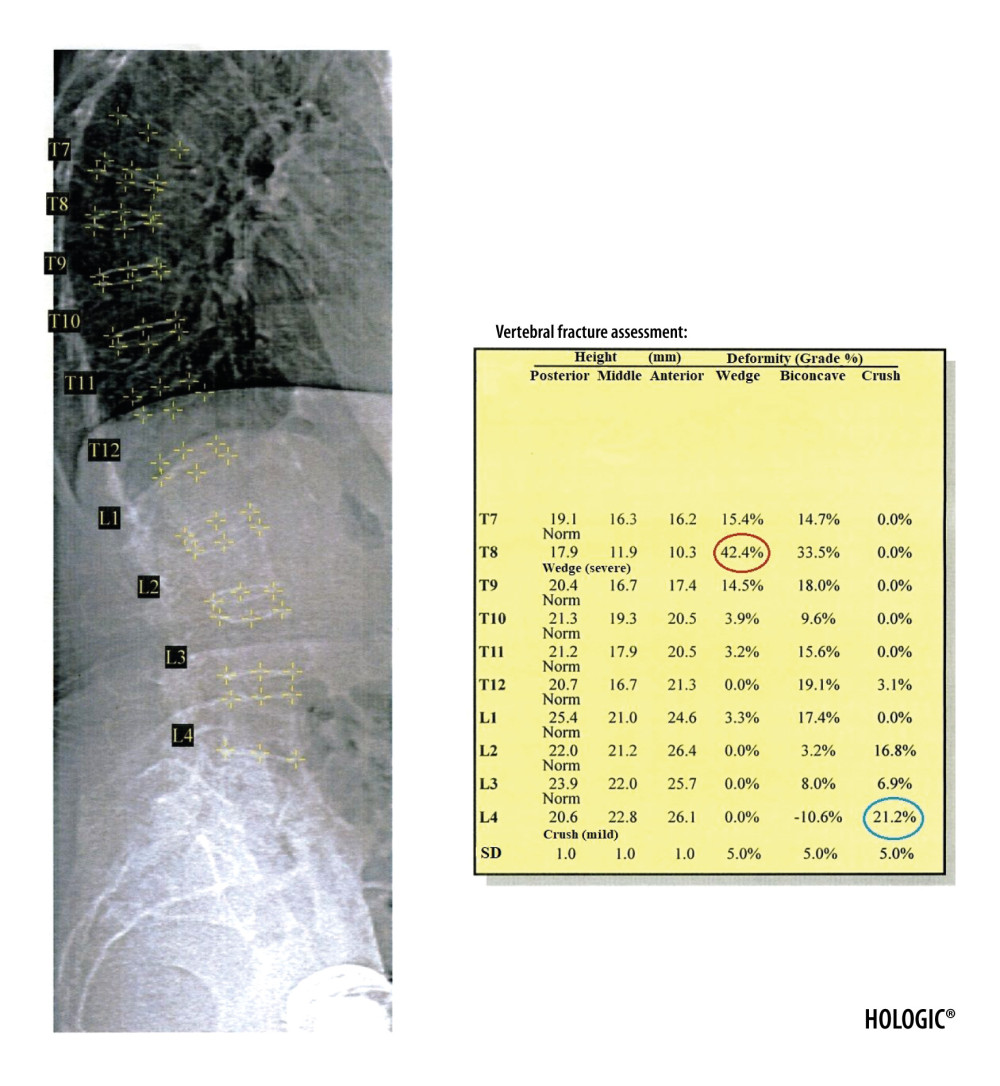 Figure 5. Severe wedge fracture of the Th8 vertebra (the degree of deformation (%) marked in red circle) and mild crush fracture of the L4 vertebra (the degree of deformation (%) marked in blue circle), based on the VFA examination.
 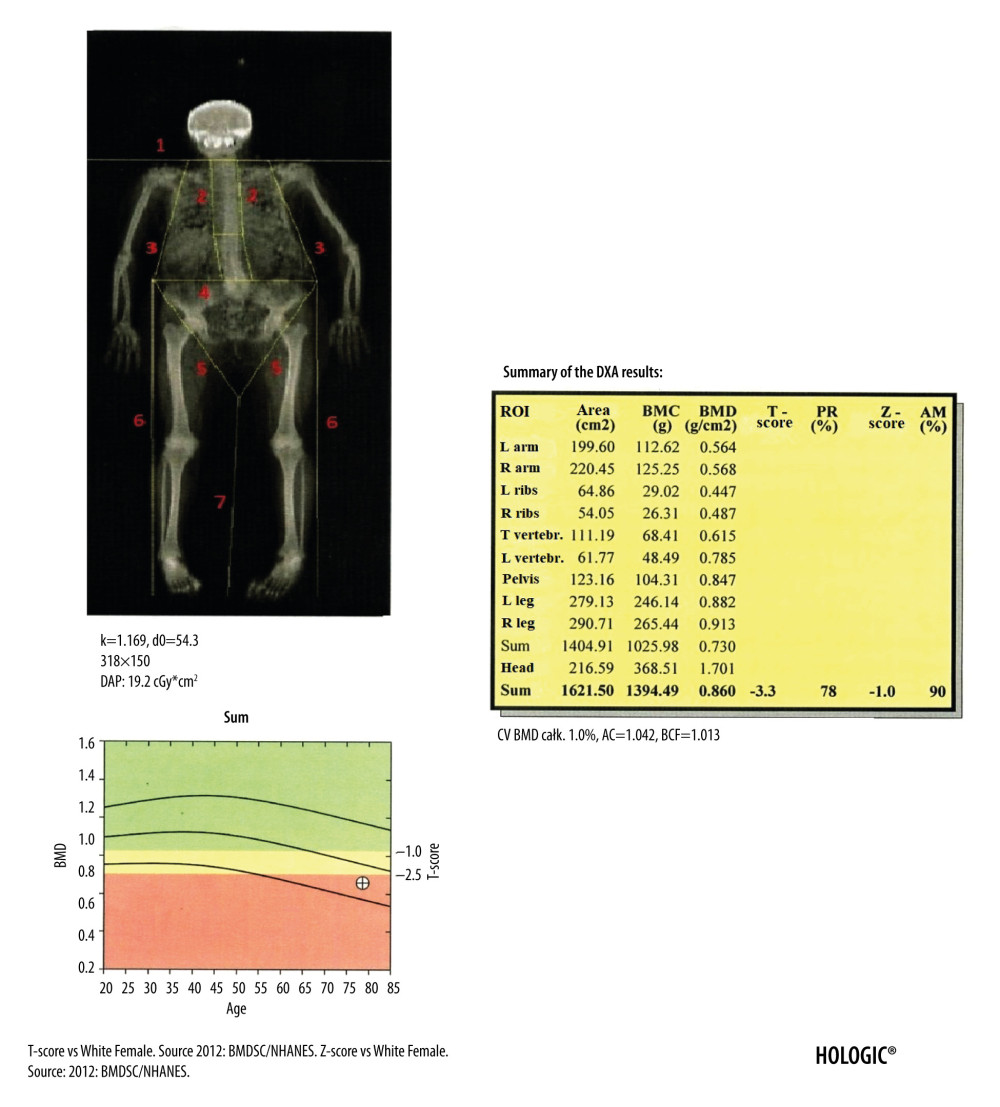 Figure 6. Result of the body composition assessment - skeletal system. ROIs are defined by lines 1–7. The line number 1 separating the head should pass directly below the chin. The line number 2 separating the spine from the chest should pass as close to the spine as possible. The line number 3 separating the upper limbs from the body should pass through the shoulder joints as close to the body as possible. A perpendicular line inside the area defined by line number 2 should separate the thoracic spine from the lumbar spine. The line number 4 separating the pelvis from the trunk should pass over the upper edge of the iliac crests. The line number 5 separating the pelvis from the lower limbs should cross the femoral necks. Line number 6 should cut the airspace between the upper and lower limbs and line number 7 the airspace between the lower limbs.
 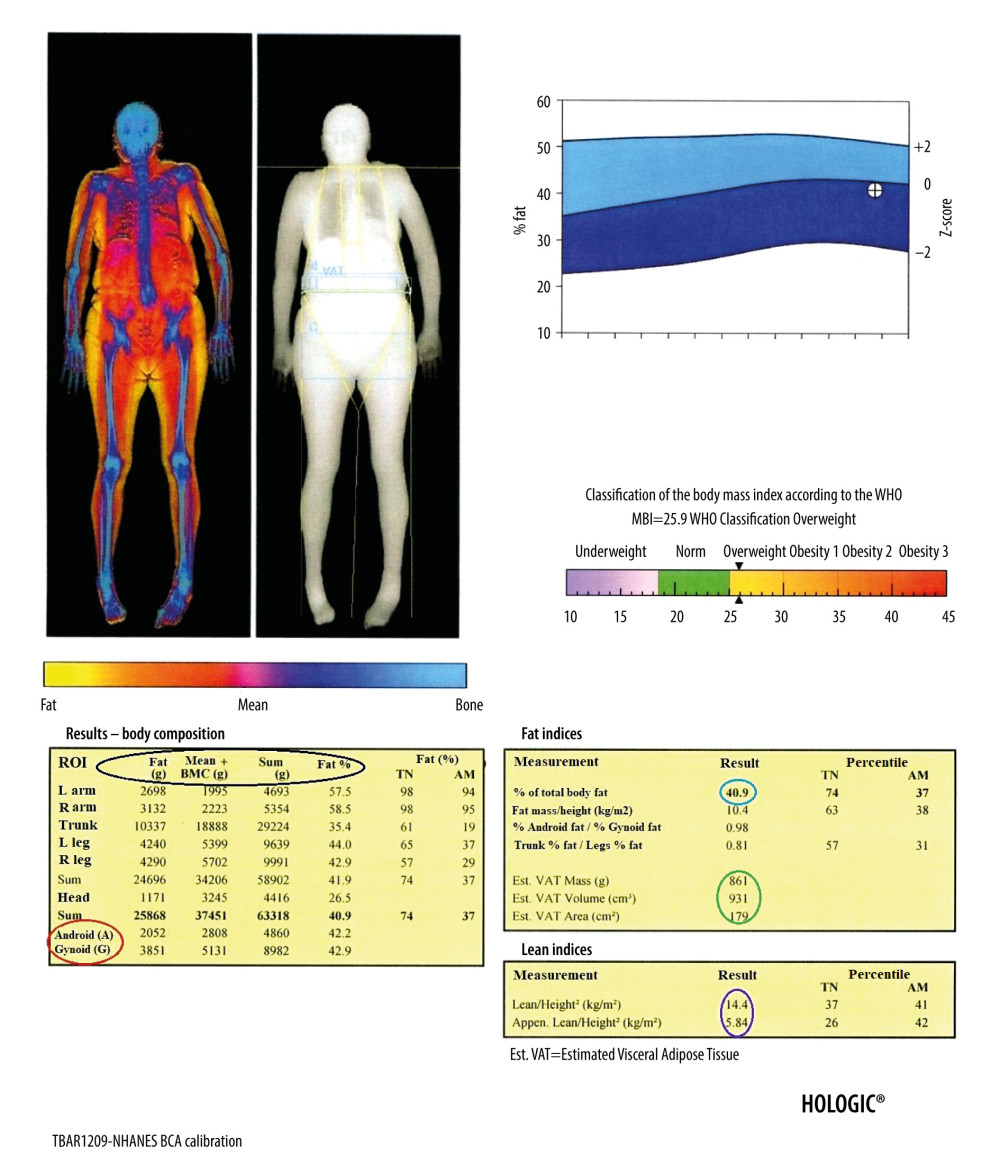 Figure 7. Result of the body composition assessment – soft tissues. The table on the left shows (parameters from the left, marked in the black circle, respectively): the mass of adipose tissue, the sum of the mass of other soft tissues and bone tissue, the total mass, and the percentage of fat tissue in individual ROIs, including the android and gynoid region (A and G in red circle, respectively). In the tables on the right are presented, among others: percentage of total body fat mass (blue circle), parameters of visceral adipose tissue (green circle), and parameters useful in the assessment of loss of muscle mass (purple circle).
 1. Kanis JA, Glüer CC, An update on the diagnosis and assessment of osteoporosis with densitometry. Committee of Scientific Advisors, International Osteoporosis Foundation: Osteoporos Int, 2000; 11(3); 192-202
2. Blake GM, Fogelman I, The role of DXA bone density scans in the diagnosis and treatment of osteoporosis: Postgrad Med J, 2007; 83(982); 509-17
3. Glüer CC, 30years of DXA technology innovations: Bone, 2017; 104; 7-12
4. Storm T, Thamsborg G, Steiniche T, Effect of intermittent cyclical etidronate therapy on bone mass and fracture rate in women with postmenopausal osteoporosis: N Engl J Med, 1990; 322; 1265-71
5. Toombs RJ, Ducher G, Shepherd JA, The impact of recent technological advances on the trueness and precision of DXA to assess body composition: Obesity (Silver Spring), 2012; 20(1); 30-39
6. Wilson PW, Kauppila LI, O’Donnell CJ, Abdominal aortic calcific deposits are an important predictor of vascular morbidity and mortality: Circulation, 2001; 103(11); 1529-34
7. Messina C, Albano D, Gitto S, Body composition with dual energy X-ray absorptiometry: from basics to new tools: Quant Imaging Med Surg, 2020; 10(8); 1687-98
8. Writing Group for the ISCD Position Development Conference, Diagnosis of osteoporosis in men, premenopausal women, and children: J Clin Densitom, 2004; 7(1); 17-26
9. Siris ES, Adler R, Bilezikian J, The clinical diagnosis of osteoporosis: A position statement from the National Bone Health Alliance Working Group: Osteoporos Int, 2014; 25(5); 1439-43
10. Kanis JA, McCloskey EV, Johansson H, European guidance for the diagnosis and management of osteoporosis in postmenopausal women: Osteoporos Int, 2013; 24(1); 23-57
11. Cosman F, de Beur SJ, LeBoff MSNational Osteoporosis Foundation, Clinician’s guide to prevention and treatment of osteoporosis: Osteoporos Int, 2014; 25(10); 2359-81
12. Apazidis A, Ricart PA, Diefenbach CM, Spivak JM, The prevalence of transitional vertebrae in the lumbar spine: Spine J, 2011; 11(9); 858-62
13. Nardo L, Alizai H, Virayavanich W, Lumbosacral transitional vertebrae: Association with low back pain: Radiology, 2012; 265(2); 497-503
14. Doroudinia A, Colletti PM, Bone mineral measurements: Clin Nucl Med, 2015; 40(8); 647-57
15. Kęska A, Lutosławska G, Bertrandt J, Sobczak M, Relationships between bone mineral density and new indices of body composition in young, sedentary men and women: Ann Agric Environ Med, 2018; 25(1); 23-25
16. Shepherd JA, Cheng XG, Lu Y, Universal standardization of forearm bone densitometry: J Bone Miner Res, 2002; 17(4); 734-45
17. Rosen EO, McNamara EA, Whittaker LG, Effect of positioning of the ROI on BMD of the forearm and its subregions: J Clin Densitom, 2018; 21(4); 529-33
18. Bandirali M, Lanza E, Messina C, Dose absorption in lumbar and femoral dual energy X-ray absorptiometry examinations using three different scan modalities: An anthropomorphic phantom study: J Clin Densitom, 2013; 16(3); 279-82
19. Kendler DL, Borges JL, Fielding RA, The Official Positions of the International Society for Clinical Densitometry: Indications of use and reporting of DXA for body composition: J Clin Densitom, 2013; 16; 496-507
20. Mettler FA, Huda W, Yoshizumi TT, Mahesh M, Effective doses in radiology and diagnostic nuclear medicine: A catalog: Radiology, 2008; 248; 254-63
21. Rud B, Vestergaard A, Hyldstrup L, Accuracy of densitometric vertebral fracture assessment when performed by DXA technicians – a cross-sectional, multiobserver study: Osteoporos Int, 2016; 27(4); 1451-58
22. Van der Velde R, Ozanian T, Dumitrescu B, Performance of statistical models of shape and appearance for semiautomatic segmentations of spinal vertebrae T4-L4 on digitized vertebral fracture assessment images: Spine J, 2015; 15(6); 1248-54
23. Muszkat P, Camargo MB, Peters BS, Digital vertebral morphometry performed by DXA: A valuable opportunity for identifying fractures during bone mass assessment: Arch Endocrinol Metab, 2015; 59(2); 98-104
24. Schousboe JT, Debold CR, Reliability and accuracy of vertebral fracture assessment with densitometry compared to radiography in clinical practice: Osteoporos Int, 2006; 17(2); 281-89
25. Clark EM, Carter L, Gould VC, Vertebral fracture assessment (VFA) by lateral DXA scanning may be cost-effective when used as part of fracture liaison services or primary care screening: Osteoporos Int, 2014; 25(3); 953-64
26. Diacinti D, Guglielmi G, Pisani D, Vertebral morphometry by dual-energy X-ray absorptiometry (DXA) for osteoporotic vertebral fractures assessment (VFA): Radiol Med, 2012; 117(8); 1374-85
27. Kunitoki K, Mutoh T, Tatewaki Y, Clinical utility of a semiquantitative method using lumbar radiography as a screening tool for osteoporosis in elderly subjects: Med Sci Monit, 2019; 25; 6928-34
28. Oh SH, Kim D, Lee YE, Comparison of screening strategies for prevalent vertebral fractures in South Korea: Vertebral fracture assessment vs. spine radiograph: BMC Musculoskelet Disord, 2018; 19(1); 46
29. Chen Z, Wu Y, Ning S, Risk factors of secondary vertebral compression fracture after percutaneous vertebroplasty or kyphoplasty: A retrospective study of 650 patients: Med Sci Monit, 2019; 25; 9255-61
30. Malgo F, Hamdy NAT, Ticheler CHJM, Value and potential limitations of vertebral fracture assessment (VFA) compared to conventional spine radiography: Experience from a fracture liaison service (FLS) and a meta-analysis: Osteoporos Int, 2017; 28(10); 2955-65
31. Schousboe JT, Taylor BC, Kiel DP, Abdominal aortic calcification detected on lateral spine images from a bone densitometer predicts incident myocardial infarction or stroke in older women: J Bone Miner Res, 2008; 23(3); 409-16
32. Benjamens S, Pol RA, Glaudemans AWJM, A high abdominal aortic calcification score by dual X-ray absorptiometry is associated with cardiovascular events after kidney transplantation: Nephrol Dial Transplant, 2018; 33(12); 2253-59
33. Mäkelä SM, Asola M, Hadimeri H, Abdominal aortic calcifications predict survival in peritoneal dialysis patients: Perit Dial Int, 2018; 38(5); 366-73
34. Danielson ME, Beck TJ, Lian Y, Ethnic variability in bone geometry as assessed by hip structure analysis: Findings from the hip strength across the menopausal transition study: J Bone Miner Res, 2013; 28(4); 771-79
35. Kaptoge S, Beck TJ, Reeve J, Prediction of incident hip fracture risk by femur geometry variables measured by hip structural analysis in the study of osteoporotic fractures: J Bone Miner Res, 2008; 23(12); 1892-904
36. Uusi-Rasi K, Semanick LM, Zanchetta JR, Effects of teriparatide [rhPTH (1–34)] treatment on structural geometry of the proximal femur in elderly osteoporotic women: Bone, 2005; 36(6); 948-58
37. Genant HK, Lewiecki EM, Fuerst T, Fries M, Effect of monthly ibandronate on hip structural geometry in men with low bone density: Osteoporos Int, 2012; 23(1); 257-65
38. Bonnick SL, Beck TJ, Cosman F, DXA-based hip structural analysis of once-weekly bisphosphonate-treated postmenopausal women with low bone mass: Osteoporos Int, 2009; 20(6); 911-21
39. Sone T, Kon N, Gaither KW, Effects of 3-year denosumab treatment on hip structure in Japanese postmenopausal women and men with osteoporosis: Bone Rep, 2017; 14(7); 164-71
40. Danielson ME, Beck TJ, Karlamangla AS, A comparison of DXA and CT based methods for estimating the strength of the femoral neck in post-menopausal women: Osteoporos Int, 2013; 24(4); 1379-88
41. Kim KK, Park YW, Kim TH, Atypical femoral neck fracture after prolonged bisphosphonate therapy: J Pathol Transl Med, 2020; 54(4); 346-50
42. Schilcher J, Micha¸lsson K, Aspenberg P, Bisphosphonate use and atypical fractures of the femoral shaft: N Engl J Med, 2011; 364(18); 1728-37
43. McKenna MJ, Van der Kamp S, Heffernan E, Hurson C, Incomplete atypical femoral fractures: Assessing the diagnostic utility of DXA by extending femur length: J Clin Densitom, 2013; 16(4); 579-83
44. Cheung AM, McKenna MJ, van de Laarschot DM, Detection of atypical femur fractures: J Clin Densitom, 2019; 22(4); 506-16
45. Mohan PC, Howe TS, Koh JS, Radiographic features of multifocal endosteal thickening of the femur in patients on long-term bisphosphonate therapy: Eur Radiol, 2013; 23(1); 222-27
46. Png MA, Mohan PC, Koh JSB, Natural history of incomplete atypical femoral fractures in patients after a prolonged and variable course of bisphosphonate therapy-a long-term radiological follow-up: Osteoporos Int, 2019; 30(12); 2417-28
47. Bogdan Y, Tornetta P, Einhorn TA, Healing time and complications in operatively treated atypical femur fractures associated with bisphosphonate use: a multicenter retrospective cohort: J Orthop Trauma, 2016; 30(4); 177-81
48. Van de Laarschot DM, Smits AA, Buitendijk SK, Screening for atypical femur fractures using extended femur scans by DXA: J Bone Miner Res, 2017; 32(8); 1632-39
49. Ahlman MA, Rissing MS, Gordon L, Evolution of bisphosphonate-related atypical fracture retrospectively observed with DXA scanning: J Bone Miner Res, 2012; 27(2); 496-98
50. Naylor KE, McCloskey EV, Eastell R, Yang L, Use of DXA-based finite element analysis of the proximal femur in a longitudinal study of hip fracture: J Bone Miner Res, 2013; 28(5); 1014-21
51. Yang S, Leslie WD, Luo Y, Automated DXA-based finite element analysis for hip fracture risk stratification: A cross-sectional study: Osteoporos Int, 2018; 29(1); 191-200
52. Dall’Ara E, Eastell R, Viceconti M, Experimental validation of DXA-based finite element models for prediction of femoral strength: J Mech Behav Biomed Mater, 2016; 63; 17-25
53. Westbury LD, Shere C, Edwards MH, Cluster analysis of finite element analysis and bone microarchitectural parameters identifies phenotypes with high fracture risk: Calcif Tissue Int, 2019; 105(3); 252-62
54. Morgan EF, Bayraktar HH, Keaveny TM, Trabecular bone modulus – density relationships depend on anatomic site: J Biomech, 2003; 36(7); 897-904
55. Yang S, Luo Y, Yang L, Comparison of femoral strength and fracture risk index derived from DXA-based finite element analysis for stratifying hip fracture risk: A cross-sectional study: Bone, 2018; 110; 386-91
56. van den Kroonenberg AJ, Hayes WC, McMahon TA, Dynamic models for sideways falls from standing height: J Biomech Eng, 1995; 117(3); 309-18
57. Robinovitch SN, McMahon TA, Hayes WC, Force attenuation in trochanteric soft tissues during impact from a fall: J Orthop Res, 1995; 13(6); 956-62
58. Mancuso ME, Johnson JE, Ahmed SS, Distal radius microstructure and finite element bone strain are related to site-specific mechanical loading and areal bone mineral density in premenopausal women: Bone Reports, 2018; 8; 187-94
59. Colombo C, Libonati F, Rinaudo L, A new finite element-based parameter to predict bone fracture: PLoS One, 2019; 14(12); e0225905
60. Leslie WD, Majumdar SR, Morin SN, Performance of FRAX in clinical practice according to sex and osteoporosis definitions: The Manitoba BMD registry: Osteoporos Int, 2018; 29(3); 759-67
61. Harvey NC, Glüer CC, Binkley N, Trabecular bone score (TBS) as a new complementary approach for osteoporosis evaluation in clinical practice: Bone, 2015; 78; 216-24
62. Silva BC, Leslie WD, Resch H, Trabecular bone score: A noninvasive analytical method based upon the DXA image: J Bone Miner Res, 2014; 29(3); 518-30
63. Winzenrieth R, Michelet F, Hans D, Three-dimensional (3D) microarchitecture correlations with 2D projection image gray-level variations assessed by trabecular bone score using high-resolution computed tomographic acquisitions: effects of resolution and noise: J Clin Densitom, 2013; 16; 287-96
64. Hans D, Šteňová E, Lamy O, The Trabecular Bone Score (TBS) complements DXA and the FRAX as a fracture risk assessment tool in routine clinical practice: Curr Osteoporos Rep, 2017; 15(6); 521-31
65. Krieg MA, Ubry-Rozier B, Hans D, Leslie WD, Effects of anti-resorptive agents on trabecular bone score (TBS) in older women: Osteoporos Int, 2013; 24; 1073-78
66. Albano D, Messina C, Vitale J, Sconfienza LM, Imaging of sarcopenia: Old evidence and new insights: Eur Radiol, 2020; 30; 2199-208
67. Konieczna J, Abete I, Galmés AM, Body adiposity indicators and cardiometabolic risk: Cross-sectional analysis in participants from the PREDIMED-Plus trial: Clin Nutr, 2019; 38(4); 1883-91
68. Goldberg EK, Fung EB, Precision of the hologic DXA in the assessment of visceral adipose tissue: J Clin Densitom, 2020; 23(4); 664-72
69. Neeland IJ, Grundy SM, Li X, Comparison of visceral fat mass measurement by dual-X-ray absorptiometry and magnetic resonance imaging in a multiethnic cohort: The Dallas Heart Study: Nutr Diabetes, 2016; 6; e221
70. Micklesfield LK, Goedecke JH, Punyanitya M, Dual-energy X-ray performs as well as clinical computed tomography for the measurement of visceral fat: Obesity, 2012; 20; 1109-14
71. Kuk JL, Katzmarzyk PT, Nichaman MZ, Visceral fat is an independent predictor of all-cause mortality in men: Obesity (Silver Spring), 2006; 14; 336-41
72. Spadaccini D, Perna S, Peroni G, DXA-derived Visceral Adipose Tissue (VAT) in elderly: Percentiles of reference for gender and association with metabolic outcomes: Life (Basel), 2020; 10(9); 163
73. Toss F, Wiklund P, Nordström P, Nordström A, Body composition and mortality risk in later life: Age Ageing, 2012; 41(5); 677-81
74. Beraldo RA, Vassimon HS, Navarro AM, Foss-Freitas MC, Development of predictive equations for total and segmental body fat in HIV-seropositive patients: Nutrition, 2015; 31(1); 127-31
75. Papadimas GK, Terzis G, Methenitis S, Body composition analysis in late-onset Pompe disease: Mol Genet Metab, 2011; 102(1); 41-43
76. Franzoni E, Ciccarese F, Di Pietro E, Follow-up of bone mineral density and body composition in adolescents with restrictive anorexia nervosa: Role of dual-energy X-ray absorptiometry: Eur J Clin Nutr, 2014; 68(2); 247-52
77. Heshka S, Lemos T, Astbury NM, Resting energy expenditure and organ-tissue body composition 5 years after bariatric surgery: Obes Surg, 2020; 30(2); 587-94
78. Bauer J, Morley JE, Schols AMWJ, Sarcopenia: A time for action. An SCWD position paper: J Cachexia Sarcopenia Muscle, 2019; 10(5); 956-61
79. Cruz-Jentoft AJ, Bahat G, Bauer J, Sarcopenia: Revised European consensus on definition and diagnosis: Age Ageing, 2019; 48; 16-31
80. Parker AM, Yang L, Farzi M, Quantifying pelvic periprosthetic bone remodeling using dual-energy X-ray absorptiometry region-free analysis: J Clin Densitom, 2017; 20(4); 480-85
81. Wilkinson JM, Morris RM, Martin-Fernandez MA, Use of high-resolution dual-energy x-ray absorptiometry-region free analysis (DXA-RFA) to detect local periprosthetic bone remodeling events: J Orthop Res, 2015; 33(5); 712-16
82. Farzi M, Morris RM, Penny J, Quantitating the effect of prosthesis design on femoral remodeling using high-resolution region-free densitometric analysis (DXA-RFA): J Orthop Res, 2017; 35(10); 2203-10
83. Albanese CV, Santori FS, Pavan L, Periprosthetic DXA after total hip arthroplasty with short vs. ultra-short custom-made femoral stems: 37 patients followed for 3 years: Acta Orthop, 2009; 80(3); 291-97
84. Shuhart CR, Yeap SS, Anderson PA, Executive summary of the 2019 ISCD position development conference on monitoring treatment, DXA cross-calibration and least significant change, spinal cord injury, peri-prosthetic and orthopedic bone health, transgender medicine, and pediatrics: J Clin Densitom, 2019; 22(4); 453-71
85. Morris RM, Yang L, Martín-Fernández MA, High-spatial-resolution bone densitometry with dual-energy X-ray absorptiometric region-free analysis: Radiology, 2015; 274(2); 532-39
86. Peitgen DS, Innmann MM, Merle C, Periprosthetic bone mineral density around uncemented titanium stems in the second and third decade after total hip arthroplasty: A DXA study after 12, 17 and 21 years: Calcif Tissue Int, 2018; 103(4); 372-79
87. Blaty T, Krueger D, Illgen R, DXA evaluation of femoral bone mineral density and cortical width in patients with prior total knee arthroplasty: Osteoporos Int, 2019; 30(2); 383-90
88. Holm-Glad T, Godang K, Bollerslev J, Assessing periprosthetic bone in total wrist arthroplasty: The validity of DXA: J Clin Densitom, 2020 [Online ahead of print]
89. de Zanini RV, Santos IS, Chrestani MA, Gigante DP, Body fat in children measured by DXA, air-displacement plethysmography, TBW and multicomponent models: A systematic review: Matern Child Health J, 2015; 19(7); 1567-73
90. Quintal VS, Diniz EM, de Caparbo VF, Pereira RM, Bone densitometry by dual-energy X-ray absorptiometry (DXA) in preterm newborns compared with full-term peers in the first six months of life: J Pediatr (Rio J), 2014; 90(6); 556-62
91. Boghossian NS, Koo W, Liu A, Longitudinal measures of maternal vitamin D and neonatal body composition: Eur J Clin Nutr, 2018; 73(3); 424-31
Figures
Figure 1. DXA examination of the lumbar spine. At the bottom of the picture is visible the borderline L5/S1, at the top the last pair of ribs connected to the Th12 vertebra. The presented image of the lumbar spine is not suitable for diagnostic objectives, but it is used to identify the ROI in the lumbar spine (vertebral bodies from L1 to L4). The diagnostic result is the T-score parameter estimated for the entire examined ROI area (circled in red). If, due to degenerative changes or artifacts, all 4 lumbar vertebrae cannot be used for analysis, 3 vertebrae should be used. The result of examination is reliable if at least 2 vertebrae are suitable for analysis.Figure 2. DXA examination of the hip. The diagnostic result is the T-score parameter estimated for the femoral neck (the upper value in the red circle) and for the total proximal femur (the lower value in the red circle). The ROI of the femoral neck (marked as green frame) should be perpendicular to the femoral neck, should not include the greater trochanter and the ischial bone, but should include soft tissues on both sides of the femoral neck. The midline (marked as green line) should cover the long axis of the femoral neck. In the blue circle is marked the FRAX for major osteoporotic fracture (upper value) and FRAX for hip fracture (lower value).Figure 3. The DXA examination of the right forearm. The diagnostic result is the T-score parameter estimated for the 1/3 ROI of nondominant forearm (blue frame). The reference line (marked in purple) should be positioned at the distal end of the styloid process of the ulna, the radius plate should be located outside the ROI UD (green frame), and a vertical line crossing the middle of the 1/3, MID, and UD ROI (marked in red) should cut the airspace between the radius and ulna.Figure 4. Result of the VFA examination in the thoracic and lumbar spine. The table shows individual vertebral heights in millimeters (marked in the black circle – the posterior, middle and anterior height, respectively, in order from the left) and the degree of deformation (%) of vertebral bodies (marked in the green circle – the wedge, biconcave and crush deformation, respectively, in order from the left). The red arrow indicates the position of the sacrum and the blue arrow the position of the L5 vertebra. Clear visualization of the sacrum and vertebra L5 is necessary for identification of examined vertebrae.Figure 5. Severe wedge fracture of the Th8 vertebra (the degree of deformation (%) marked in red circle) and mild crush fracture of the L4 vertebra (the degree of deformation (%) marked in blue circle), based on the VFA examination.Figure 6. Result of the body composition assessment - skeletal system. ROIs are defined by lines 1–7. The line number 1 separating the head should pass directly below the chin. The line number 2 separating the spine from the chest should pass as close to the spine as possible. The line number 3 separating the upper limbs from the body should pass through the shoulder joints as close to the body as possible. A perpendicular line inside the area defined by line number 2 should separate the thoracic spine from the lumbar spine. The line number 4 separating the pelvis from the trunk should pass over the upper edge of the iliac crests. The line number 5 separating the pelvis from the lower limbs should cross the femoral necks. Line number 6 should cut the airspace between the upper and lower limbs and line number 7 the airspace between the lower limbs.Figure 7. Result of the body composition assessment – soft tissues. The table on the left shows (parameters from the left, marked in the black circle, respectively): the mass of adipose tissue, the sum of the mass of other soft tissues and bone tissue, the total mass, and the percentage of fat tissue in individual ROIs, including the android and gynoid region (A and G in red circle, respectively). In the tables on the right are presented, among others: percentage of total body fat mass (blue circle), parameters of visceral adipose tissue (green circle), and parameters useful in the assessment of loss of muscle mass (purple circle). In Press
06 Mar 2024 : Clinical Research
Comparison of Outcomes between Single-Level and Double-Level Corpectomy in Thoracolumbar Reconstruction: A ...Med Sci Monit In Press; DOI: 10.12659/MSM.943797
21 Mar 2024 : Meta-Analysis
Economic Evaluation of COVID-19 Screening Tests and Surveillance Strategies in Low-Income, Middle-Income, a...Med Sci Monit In Press; DOI: 10.12659/MSM.943863
10 Apr 2024 : Clinical Research
Predicting Acute Cardiovascular Complications in COVID-19: Insights from a Specialized Cardiac Referral Dep...Med Sci Monit In Press; DOI: 10.12659/MSM.942612
06 Mar 2024 : Clinical Research
Enhanced Surgical Outcomes of Popliteal Cyst Excision: A Retrospective Study Comparing Arthroscopic Debride...Med Sci Monit In Press; DOI: 10.12659/MSM.941102
Most Viewed Current Articles
17 Jan 2024 : Review article
Vaccination Guidelines for Pregnant Women: Addressing COVID-19 and the Omicron VariantDOI :10.12659/MSM.942799
Med Sci Monit 2024; 30:e942799
14 Dec 2022 : Clinical Research
Prevalence and Variability of Allergen-Specific Immunoglobulin E in Patients with Elevated Tryptase LevelsDOI :10.12659/MSM.937990
Med Sci Monit 2022; 28:e937990
16 May 2023 : Clinical Research
Electrophysiological Testing for an Auditory Processing Disorder and Reading Performance in 54 School Stude...DOI :10.12659/MSM.940387
Med Sci Monit 2023; 29:e940387
01 Jan 2022 : Editorial
Editorial: Current Status of Oral Antiviral Drug Treatments for SARS-CoV-2 Infection in Non-Hospitalized Pa...DOI :10.12659/MSM.935952
Med Sci Monit 2022; 28:e935952