20 November 2021: Database Analysis
Prognostic Value of E2F Transcription Factor Expression in Pancreatic Adenocarcinoma
Lin Luo1DEF, Gerui Zhang2CF, Taihua Wu3AG*, Guangzhen Wu4BCDOI: 10.12659/MSM.933443
Med Sci Monit 2021; 27:e933443


Abstract
BACKGROUND: Pancreatic adenocarcinoma (PAAD) is one of the deadliest types of cancer. In the early stages, patients often have atypical symptoms, making diagnosis difficult. The prognosis of diagnosed patients is very poor and treating PAAD is challenging. Therefore, determining reliable risk factors related to PAAD development is critical for improving patient prognosis. E2F family transcription factors (TFs) are essential regulators of DNA synthesis and cell cycle progression in eukaryotic cells, and they have been identified as prognostic biomarkers associated with multiple cancer types. However, further research is necessary to establish the prognostic relevance of these TFs in PAAD patients.
MATERIAL AND METHODS: We assessed PAAD patient transcriptional and outcome data using the TIMER, ONCOMINE, STRING, GEPIA, cBioPortal, Kaplan-Meier Plotter, GSCALite, and starBase databases.
RESULTS: PAAD tumor tissues exhibited increased expression of E2F1/3/5/7/8 relative to that in normal tissues, while the expression of E2F2/3/6/8 was associated with a more advanced tumor stage. Survival analyses indicated that PAAD patients expressing higher levels of E2F1/2/3/7/8 exhibited shorter overall survival (OS) and disease-free survival (DFS) than patients expressing lower levels of these TFs. In addition, E2F4 and E2F6 overexpression was associated with poorer DFS and OS, respectively. We also found that the expression of E2Fs was significantly correlated with immune infiltrates, including CD8+ T cells, CD4+ T cells, B cells, dendritic cells, neutrophils, and macrophages.
CONCLUSIONS: Our study may provide new insights into the optimal choice of immunotherapy and promising novel targets for therapeutic intervention in PAAD patients.
Keywords: E2F Transcription Factors, Pancreatic Adenoma, Biomarkers, Tumor, Humans, Pancreatic Neoplasms
Background
Pancreatic adenocarcinoma (PAAD) is among the deadliest forms of cancer, with a 5-year survival rate that is under 10% [1]. PAAD incidence has risen in recent years, and because patients with early-stage disease do not exhibit reliable symptoms, it is rarely diagnosed until it is advanced, at which point patient prognosis is very poor. Identifying prognostic biomarkers associated with PAAD patient outcomes is thus vital to better guide patient management efforts and to aid in the formulation of novel therapeutics. E2F family transcription factors (TFs) serve as critical regulators of eukaryotic cell proliferation. Mammals express 8 different EF2 family proteins (E2F1-8) that are broadly classified as transcriptional activators (E2F1-E2F3a) or transcriptional repressors (E2F3b-E2F8) [2] and control biological activities such as cell cycle progression, DNA damage responses, cell death, and differentiation in a context-specific manner [3]. E2F TF expression patterns have been shown to be dysregulated in many cancers, including ovarian cancer [4], breast cancer [5], bladder cancer [6], prostate cancer [7], lung adenocarcinoma [8], and PAAD [9].
In an effort to elucidate novel prognostic biomarkers related to PAAD patient outcomes, we employed a series of bioinformatics tools and databases to systematically assess E2F expression patterns in PAAD patients. Through this approach, we explored the relationships between these TFs and patient survival while additionally clarifying their potential regulatory roles in cells to guide future studies of PAAD patient treatment.
Material and Methods
ETHICS STATEMENT:
The Academic Committee of Dalian Medical University approved this study in accordance with the Declaration of Helsinki. As all the datasets were derived from previously published literature, informed consent for research use was previously provided.
ONCOMINE ANALYSIS:
The ONCOMINE (https://www.oncomine.org/resource/main.html) database compiles gene chip data pertaining to a large collection of tumor types, enabling data mining related to tumor-related transcription profiles [10]. The mRNA levels of E2F family members in clinical tumor samples in the ONCOMINE database were compared to the levels in normal control samples using t tests, with significance thresholds of P<0.01 and fold-change (FC) >2.
TIMER ANALYSIS:
The online TIMER tool (http://timer.cistrome.org/) enables systematic analyses of immune cell populations associated with 23 cancers compiled in The Cancer Genome Atlas (TCGA) [11]. Herein, the TIMER tool was utilized to assess E2F family TF expression in a range of tumor types. The relationship between the transcription level of E2Fs and the level of immune cell infiltration in PAAD was evaluated.
GEPIA ANALYSIS:
The GEPIA webserver (http://gepia.cancer-pku.cn/) enables the standardized analysis of RNA-seq data pertaining to 9736 tumors and 8587 normal samples derived from the TCGA and GTEx databases, allowing users to compare differential gene expression and patient survival outcomes, calculate correlations between gene expression patterns, conduct dimensionality reduction analyses, and to assess other gene-related information of interest [12]. Herein, GEPIA was utilized to assess the differential expression E2F family TFs in tumors and normal samples, with P<0.05 and |log2FC| >1 as the threshold for statistical significance.
KAPLAN-MEIER PLOTTER ANALYSIS:
The Kaplan-Meier Plotter database (www.kmplot.com) compiles cancer-related gene expression and survival outcome data [13,14]. Herein, this database was used to examine the association between E2F family protein expression in PAAD patients and the overall survival (OS) and disease-free survival (DFS) of these patients as assessed using Kaplan-Meier curves following patient stratification into high- and low-expression groups for each gene of interest based upon median E2F expression levels in a given patient cohort. This tool provided P values, median mRNA expression levels, hazard ratios (HRs), and 95% confidence intervals (CIs) corresponding to these analyses.
TCGA DATA AND CBIOPORTAL:
The TCGA is a compilation of pathological and sequencing-related data associated with 30 cancer types [15]. The Provisional TCGA PAAD dataset incorporates data from 186 cases, and this database was selected for analyses of E2F expression using cBioPortal (http://www.cbioportal.org/) [16,17]. Each gene was analyzed for factors such as mutational profiles, copy number variations (CNVs) from GISTIC, mRNA expression Z-scores (RNA-Seq V2 RSEM), and protein expression Z-scores (RPPA). In addition, coexpression and network analyses were performed based on the instructions provided by cBioPortal.
PROTEIN–PROTEIN INTERACTION (PPI) NETWORK AND PATH ANALYSES:
The STRING database (v 10.5; https://string-db.org/) was employed to generate a PPI network for E2F family proteins [18], with 30 putative E2F-interacting proteins additionally being identified. The FUNRICH website was used to assess the potential functions of the genes included in the above PPI networks, with the Cytoscape ClueGo plug-in being used to conduct GO and KEGG enrichment analyses of these genes. P<0.05 served as the significance threshold for these analyses.
GSCALITE ANALYSIS:
The interactive GSCALite tool (http://bioinfo.life.hust.edu.cn/web/GSCALite/) enables users to conduct genomic analyses of particular cancers and to visualize correlations, gene expression data, and related information in a flexible manner [19]; available reporting information included differential gene expression, OS, CNVs, single-nucleotide variations, normal tissue expression levels, miRNA regulation, methylation, and drug sensitivity data. Herein, this tool was utilized to examine relationships between E2F family members and cancer-related pathways and to assess how these relationships were associated with tumor sensitivity to a range of anticancer drugs. PAAD patient OS and DFS were also analyzed with the Oncolnc website (http://www.oncolnc.org/).
STARBASE ANALYSIS:
The starBase database (http://starbase.sysu.edu.cn/agoClipRNA.php?source=lncRNA&flag) [20] was employed to assess miRNA/lncRNA regulatory relationships in PAAD, with the results of these analyses then used to construct ceRNA networks and to perform coexpression analyses. Differentially expressed lncRNAs and mRNAs associated with PAAD were submitted to starBase, and Kaplan-Meier analyses with log-rank tests were used to assess the prognostic relationship between these lncRNAs, associated mRNAs, and PAAD patient OS, with P<0.05 and |log2FC| >0.5 as the significance criteria.
HUMAN PROTEIN ATLAS (HPA):
Images of immunohistochemistry (IHC) staining for PAAD and normal tissues were collected from the HPA (
Results
ASSESSMENT OF E2F FAMILY GENE EXPRESSION IN PAAD PATIENTS:
To explore the differential expression of the 8 known E2F family TFs in PAAD patients, we used the TIMER database to compare relative expression levels of E2F1-8 in normal tissues and PAAD tumors using the TCGA dataset (Figure 1A–1H). This analysis revealed that all 8 of these E2F family members were upregulated in certain tumors, with E2F3 being significantly upregulated in pancreatic cancer patients in 6 datasets, E2F7 and E2F8 significantly upregulated in pancreatic cancer patients in 4 and 5 datasets, respectively, and E2F1 and E2F5 upregulated in pancreatic cancer patients (Figure 1I). IHC of E2F expression in PAAD was studied using the HPA (Supplementary Figure 1). The protein levels of E2F1 (Supplementary Figure 1A) were increased in PAAD tissues compared with paracancerous tissues (Supplementary Figure 1B).
ASSOCIATIONS BETWEEN E2F GENE EXPRESSION AND THE CLINICOPATHOLOGICAL CHARACTERISTICS OF PAAD PATIENTS:
Next, we explored the differences in E2F expression levels in PAAD and normal tissues using the GEPIA dataset, revealing that all 8 E2F family members (E2F1-8) were expressed at significantly higher levels in PAAD tissues relative to normal pancreatic tissues (Figure 2). We additionally examined the association between these E2F family members and tumor stage, revealing that E2F2/3/6/8 expression levels were significantly associated with tumor stage, whereas E2F1/4/5/7 expression levels were not (Figure 3).
UPREGULATION OF E2F1/2/3/7/8 AND DOWNREGULATION OF E2F4/5 ARE ASSOCIATED WITH BETTER PAAD PATIENT PROGNOSIS:
We then examined the association between E2F expression levels and PAAD patient survival using the Kaplan-Meier Plotter tool and corresponding log-rank tests, which indicated that higher levels of E2F1/2/3/7/8 and lower levels of E2F6 expression were significantly associated with OS (P<0.05) (Figure 4A), while increased E2F1/2/3/7/8 mRNA levels and decreased E2F4 mRNA levels were significantly related to DFS (P<0.05) (Figure 4B). Specifically, higher E2F1/2/3/7/8 levels were associated with poorer OS and DFS, whereas lower E2F4 and E2F6 levels were associated with poorer DFS and poorer OS, respectively.
PREDICTED FUNCTIONAL ROLES OF E2F FAMILY TFS AND RELATED GENES IN PAAD PATIENTS:
We next constructed PPI networks using the STRING tool to evaluate potential interacting proteins with E2F family members (Figure 5A). In addition, alterations in E2F proteins were assessed with the cBioPortal tool by analyzing 186 PAAD samples (TCGA, Provisional; Figure 5B) [16]. The GEPIA tool was then used to conduct analyses of E2F family TFs following Pearson’s correlation. The following significant positive correlations were identified through this analysis: E2F1 with E2F2, E2F7, and E2F8; E2F2 with E2F1 and E2F8; E2F3 with E2F4 and E2F6; E2F4 with E2F3, E2F6, and E2F8; E2F5 with E2F6; E2F6 with E2F3, E2F4, and E2F5; E2F7 with E2F1; and E2F8 with E2F1, E2F2, and E2F4 (Figure 5C). A pathway analysis of these E2F family members was then conducted with the cBioPortal tool (Figure 5D).
We then expanded these analyses by constructing PPI networks incorporating 30 E2F-related proteins (Figure 6A, Table 1). GO enrichment analyses of the 38 genes included in the above PPI network were then conducted using the FUNRICH tool (https://david.ncifcrf.gov/), which assessed the enrichment of these genes in particular biological processes (BPs), cellular components (CCs), and molecular functions (MFs) (Figure 6B–6D). Enriched BPs included regulation of nucleobase, nucleoside, nucleotide, and nucleic acid metabolism and regulation of cell cycle; enriched CCs included the nucleoplasm, chromosome, nucleus, origin recognition complex, and cyclin-dependent protein kinase holoenzyme complex; and enriched MFs included DNA binding. Enriched KEGG pathways associated with these 38 E2F family members and related genes were additionally identified (Figure 6E), revealing that they are associated with the cell cycle signaling pathway (Figure 6F).
ASSESSMENT OF THE MECHANISTIC ROLES OF E2F FAMILY MEMBERS AND ASSOCIATED CERNA NETWORK CONSTRUCTION:
To explore the mechanisms and prognostic relevance of E2F family members in PAAD patients, we leveraged the GSCALite tool to assess E2F CNVs and found that E2F1/5 amplification and E2F2/3 deletion were significantly associated with PAAD patient gene expression (Figure 7A). We also observed that methylation status was negatively correlated with the expression of the analyzed E2F family TFs in PAAD (Figure 7B). We then explored the functional importance of these E2F family members in a range of cancer-associated pathways, the results of which revealed that they are involved in cyclin activation, apoptotic pathway regulation, and DNA damage responses. Specific E2F proteins were able to inhibit the hormone AR and RAS/MAPK pathways (Figure 7C). These findings suggested that specific E2F-related genomic abnormalities have value in the context of screening for therapeutic efficacy and clinical responses to certain medications. In the drug sensitivity analyses, E2F2/3/8 expression levels were negatively correlated with drug resistance (Figure 7D).
Next, we sought to establish an miRNA-related regulatory network corresponding to PAAD by identifying upstream miRNAs associated with PAAD patient survival using GSCALite (Figure 8A), with further evaluation of the prognostic value with the Oncolnc website (http://www.oncolnc.org/). This approach identified 4 relevant miRNAs, including E2F1-related miR-126-3p, and overexpression of miR-126-3p was linked to a better patient prognosis (P<0.05) (Figure 8B). The other 3 miRNAs, miR-26a-5p, miR-140-3p, and miR-125a-5p, were associated with the expression of E2F7, with its overexpression linked to better patient outcomes (P<0.05) (Figure 8C–8E). Using starBase, we predicted upstream lncRNA regulators of these miRNAs (Figure 9A–9D). The GEPIA database indicated that the lncRNAs HCG11, MIR4435-2HG, and LINC00313 were all expressed at high levels and were closely linked to PAAD patient OS and DFS (Figure 9E–9G), which enabled us to construct a putative E2F-related ceRNA regulatory network for PAAD (Figure 9H). Coexpression analyses indicated that E2F1 was negatively correlated with HCG11 expression in PAAD patients (Figure 10A), and E2F7 expression was positively correlated with the levels of MIR4435-2HG and LINC00313 but negatively correlated with the expression of miR-140-3p and miR-26a-5p (Figure 10B).
THE TRANSCRIPTION LEVEL OF E2FS AND VARIOUS LEVELS OF IMMUNE INFILTRATION IN PAAD:
To elucidate the relationship between E2Fs and the inflammatory response and immune cell infiltration, we used the TIMER database (http://timer.cistrome.org/) for analysis; the results of which are shown in Figure 11A and indicate that the level of E2F expression is associated with the level of immune infiltration in PAAD. We found that E2F2 expression was positively correlated with the infiltration of B cells, neutrophils, and dendritic cells (Figure 11B). E2F3/4/5/6 expression was positively correlated with the infiltration of B cells, CD8+ T cells, macrophages, neutrophils, and dendritic cells (Figure 11C–11F), and E2F7 expression was positively correlated with the infiltration of CD8+ T cells and dendritic cells (Figure 11G). E2F8 expression was positively correlated with the infiltration of B cells and dendritic cells but was negatively correlated with the infiltration of CD4+ T cells (Figure 11H).
Discussion
The dysregulation of E2F family TFs has been reported in many tumor types [4–9], and the advent of novel high-throughput transcriptomic technologies has emphasized the importance of studying the functional roles of these TFs as regulators of PAAD oncogenic progression through mechanisms associated with a range of noncoding RNAs. Indeed, lncRNA/miRNA/mRNA signaling and the related regulatory mechanisms have been extensively documented in multiple cancer types [21], and the roles of these RNAs in PAAD must be clarified to better establish key diagnostic and prognostic biomarkers related to this cancer type. Herein, we conducted novel analyses of the expression and molecular roles of E2F family TFs in PAAD and explored their associations with patient outcomes by analyzing lncRNA/miRNA/mRNA signaling axes via a series of bioinformatics approaches.
E2F1 was the first identified E2F family member, and it can control the G1/S-phase transition by regulating DNA replication and controlling its own expression in a feedback loop [22]. We observed significant E2F1 overexpression in PAAD cells, which is known to promote oncogenesis and tumor cell proliferation [23]. While ONCOMINE and TCGA analyses indicated that PAAD tissues expressed higher levels of E2F1 than the healthy tissues did, this TF was not associated with clinical characteristics in PAAD patients. Despite this, higher E2F1 expression was associated with poorer patient OS and DFS. Constructed ceRNA networks further identified miR-126-3p to be related to E2F1 expression and poor patient prognosis, with HCG11 identified as an upstream lncRNA predicted to regulate miR-126-3p expression and to be negatively correlated with E2F1 expression.
E2F2 is also a key regulator of PAAD onset and progression, with miR-214-5p having previously been identified as an oncogenic regulator of this TF in PAAD [24]. Herein, we did not detect any significant difference in E2F2 expression between PAAD and normal tissues, but we did observe a significant relationship between the expression of this TF and PAAD tumor stage. Higher levels of E2F2 expression were associated with worse PAAD patient OS and DFS, and GSCALite analyses suggested that E2F2 expression levels are positively correlated with drug resistance.
E2F3 was previously identified as a key regulator of aggressive behaviors in prostate cancer and was reported to be related to tumor stage, grade, and proliferation in bladder cancer [25]. Sun et al [26] determined that the lncRNA NEAT1 can drive the progression of NSCLC by functioning as a miR-377-3p ceRNA to promote E2F3 upregulation. Consistent with these prior reports, we detected high levels of E2F3 expression in PAAD tissues relative to control tissue samples, with this expression being correlated with tumor stage. High E2F3 expression was also associated with worse PAAD patient OS and DFS and was positively correlated with drug resistance.
The E2F4 transcriptional repressor can suppress the proliferation of lung cancer cells [27]. We did not detect any significant change in E2F4 expression when comparing PAAD and normal tissue samples, and the expression of this TF was unrelated to PAAD patient tumor stage. However, high E2F4 levels were correlated with better DFS in PAAD patients but were unrelated to OS. These results are in line with the ability of E2F4 to function as a tumor suppressor.
E2F5 has been shown to be expressed at high levels in glioblastoma and prostate cancer [28,29]. While we observed increased E2F5 expression in PAAD tissues compared to normal tissues, it was unrelated to PAAD patient tumor stage or survival outcomes.
E2F6 is known to function as an oncogene in lung cancer, and miR-424 can suppress its expression and consequently disrupt A549 cell proliferation and migration [29,30]. We observed no significant difference in E2F6 expression in PAAD, although it was related to patient tumor staging. Additionally, no association between E2F6 expression and patient prognosis was detected.
E2F7 is a tumor suppressor gene encoded on chromosome 12q21.2 that controls cell cycle progression [31]. We observed significantly increased E2F7 expression in PAAD patient tumors relative to control tissues, and higher expression of this TF was associated with worse PAAD patient OS and DFS. However, the expression of E2F7 was unrelated to other clinical characteristics of PAAD patients. Three total miRNAs were identified as having a relationship with E2F7 (miR-140-3p, miR-26a-5p, and miR-125a-5p), and their overexpression was related to poor patient outcomes. Using the starBase tool, we additionally identified MIR4435-2HG and LINC00313 as putative upstream lncRNAs that were positively correlated with E2F7 expression in PAAD, and the expression of this TF was negatively correlated with the expression of miR-26a-5p and miR-140-3p.
E2F8 can block the activity of other E2F family TFs and bind in a dominant-negative fashion to the cyclin D1 promoter [32], but it has not been studied in the context of PAAD. We found that PAAD tumors exhibited increased E2F8 expression relative to that in normal tissues and that the expression of this TF was related to tumor stage. In addition, higher E2F8 expression was linked to poorer OS and DFS in PAAD patients, and E2F8 levels were positively correlated with drug resistance.
Conclusions
In summary, we observed marked upregulation of E2F1-8 in PAAD, suggesting that these TFs play key roles in the onset and progression of this deadly form of malignancy. Specifically, we determined that E2F1/2/3/7/8 may represent viable prognostic biomarkers of PAAD patient survival, whereas E2F2/3/6/8 levels were significantly related to tumor stages in these patients. As such, E2F2/3/8 may represent promising targets for PAAD treatment, although additional research will be essential to confirm the validity of these results and the utility of E2Fs as therapeutic targets or prognostic biomarkers. The expression of E2Fs and the infiltration of the 6 immune cell types in PAAD suggests that E2Fs may be involved in the regulation of PAAD tumor immunity. This indicates that E2Fs not only can be used as a prognostic indicator of patients with PAAD but also reflect the patients’ immune status.
Figures
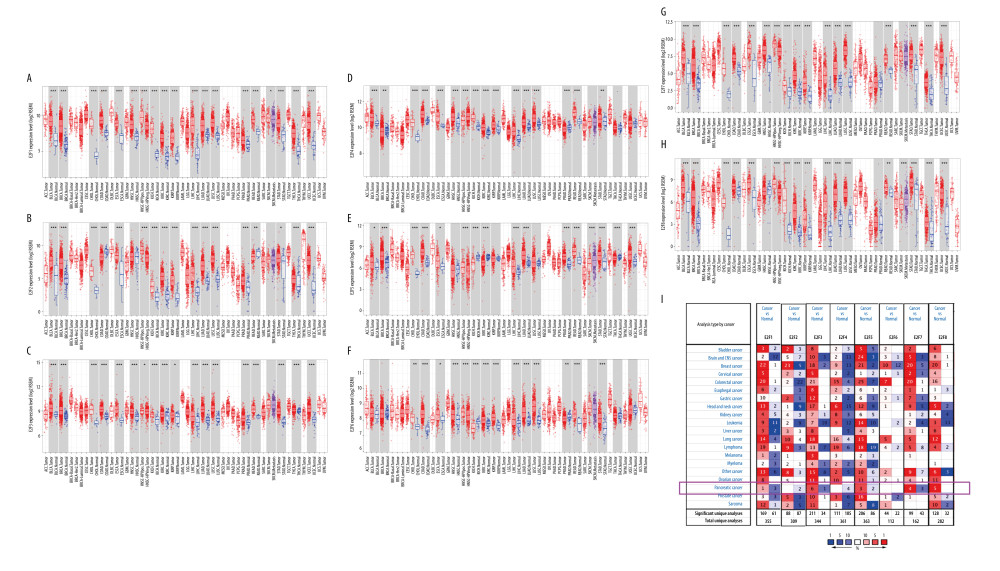 Figure 1. Expression levels of the E2F family of proteins in different cancers. (A–H) E2F family TF expression levels in different cancer types and corresponding normal tissues as assessed with the TIMER database. (I) The transcriptional expression of E2F family members in different cancers and corresponding normal tissues as assessed with the ONCOMINE database.
 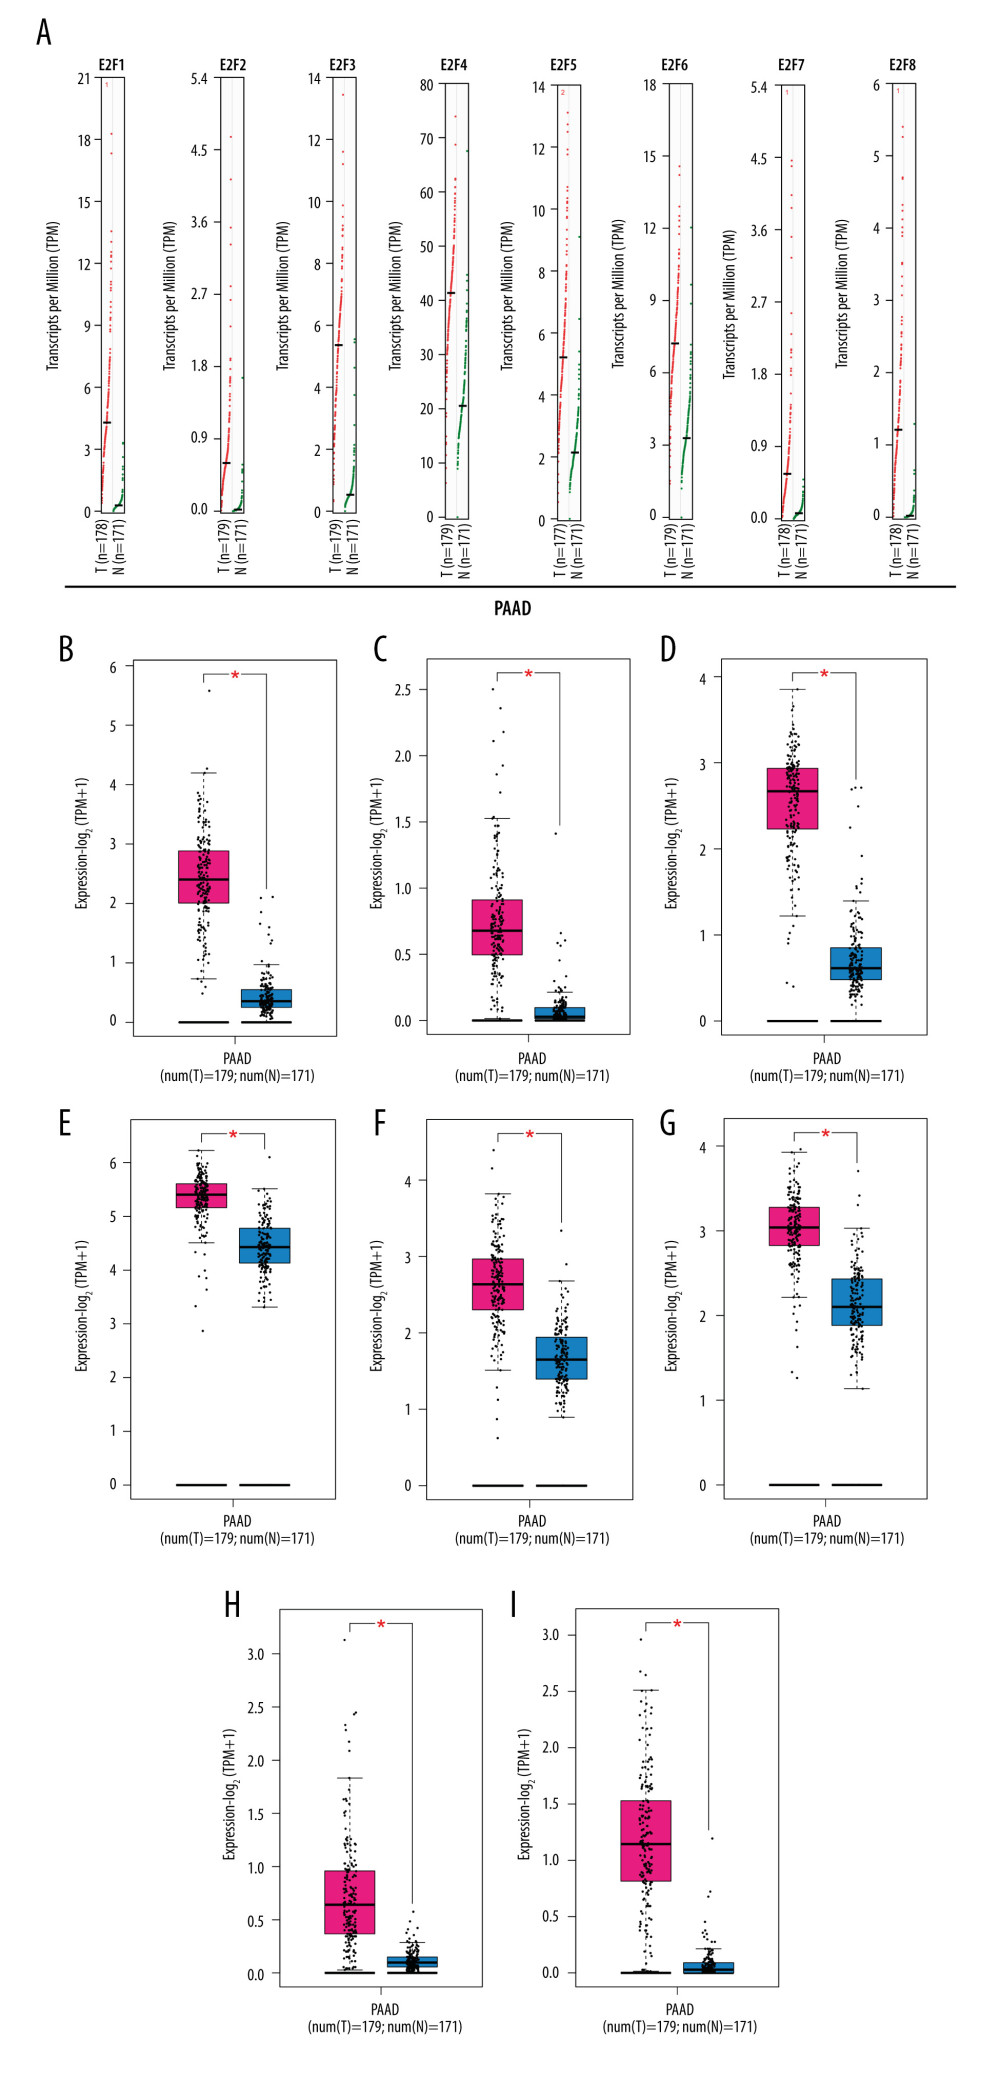 Figure 2. GEPIA-based assessment of E2F protein expression levels in PAAD. (A) Differential E2F protein expression in PAAD and normal tissue samples was assessed using the GEPIA database. (B–I) Box plots were used to demonstrate differences in E2F expression between PAAD and normal tissues in the GEPIA database.
 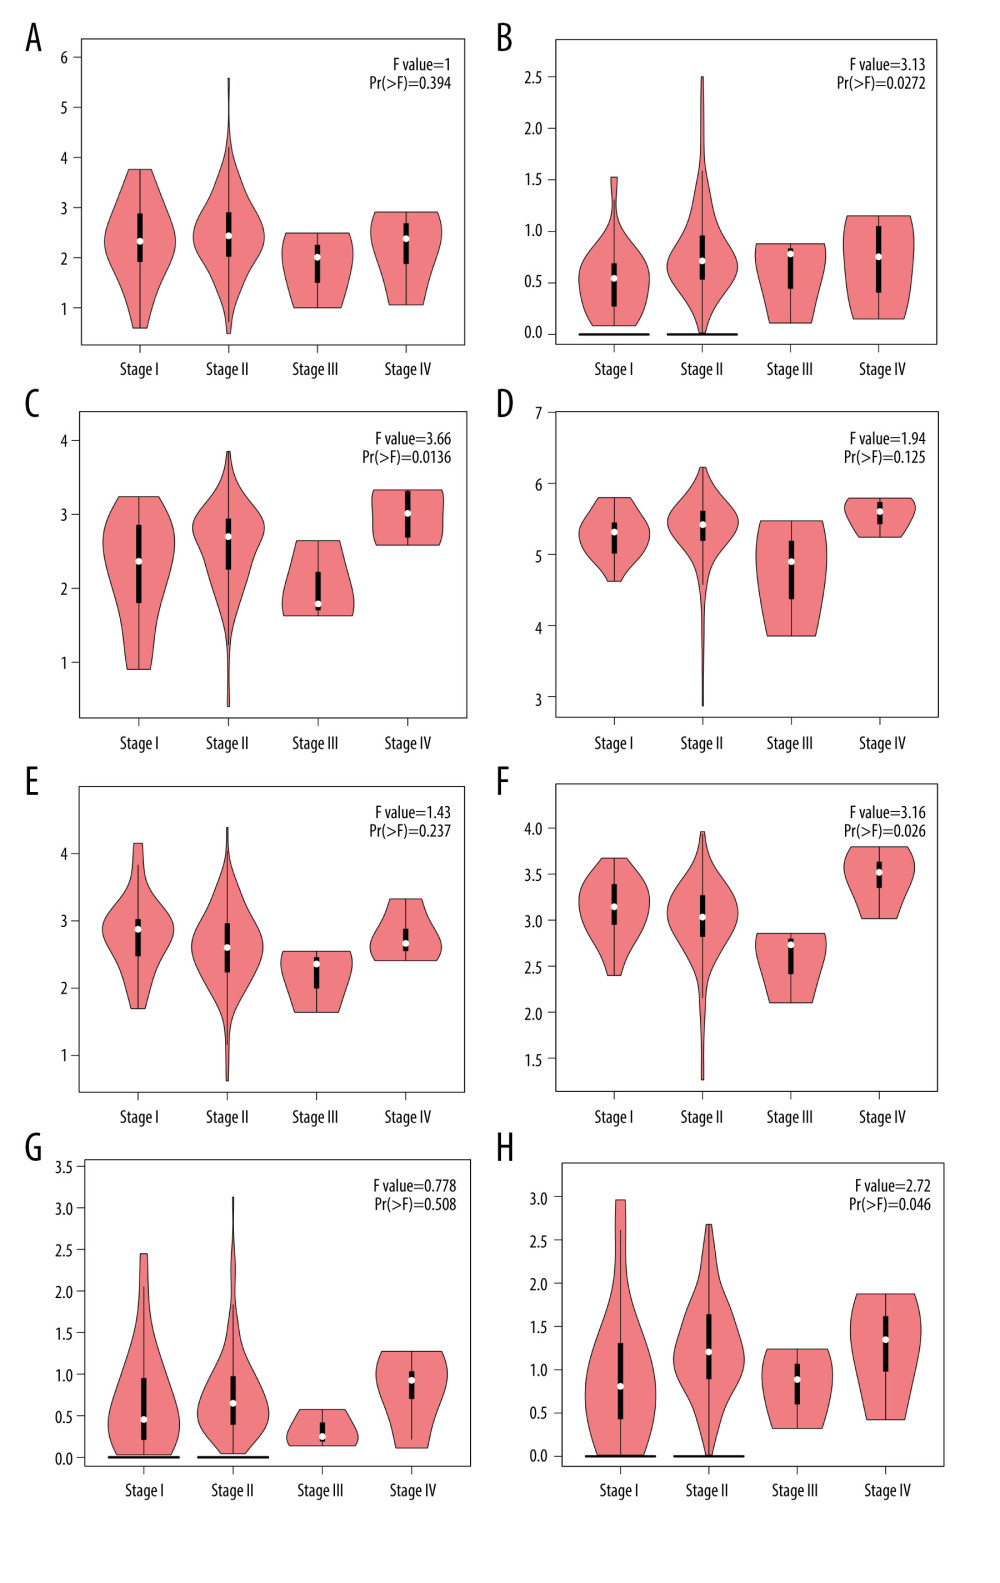 Figure 3. (A–H) Correlation between the expression of E2F family proteins and PAAD tumor stage as assessed using GEPIA.
 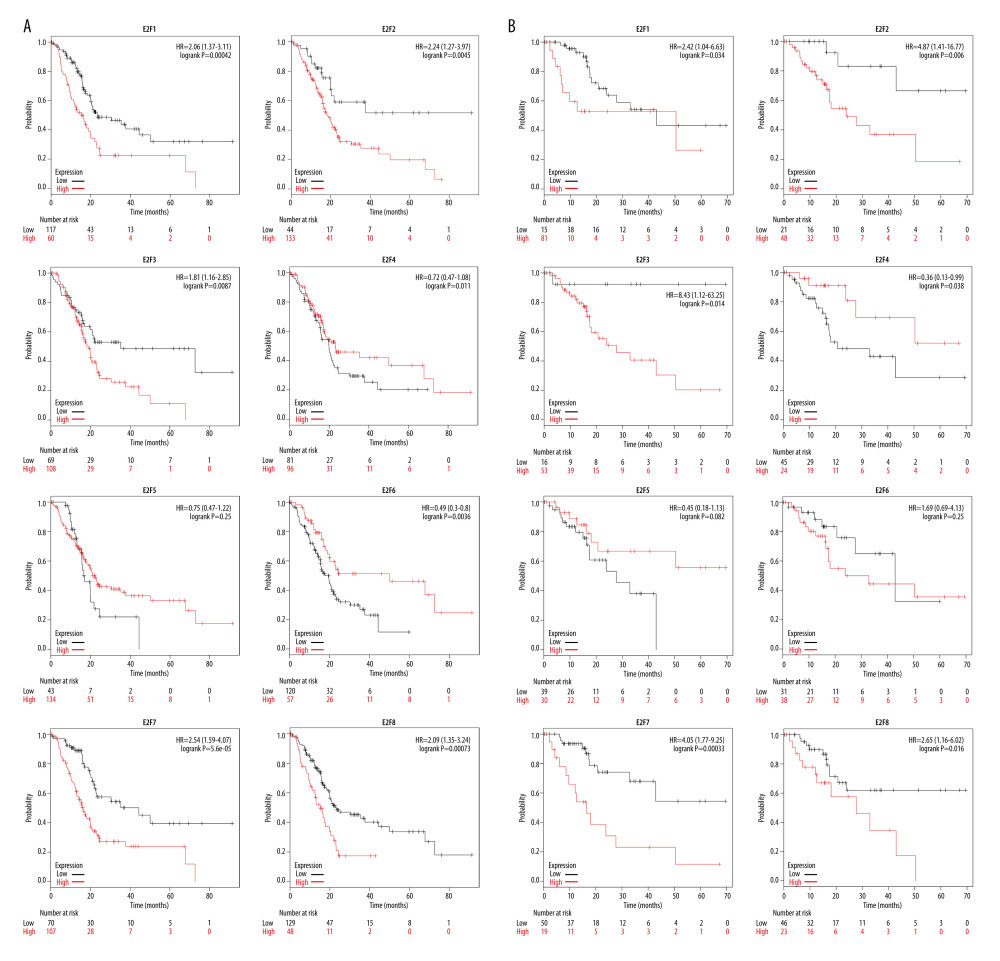 Figure 4. (A, B) Evaluation of the prognostic relevance of E2F family TF mRNA expression levels in PAAD patients, as assessed using the Kaplan-Meier Plotter tool.
 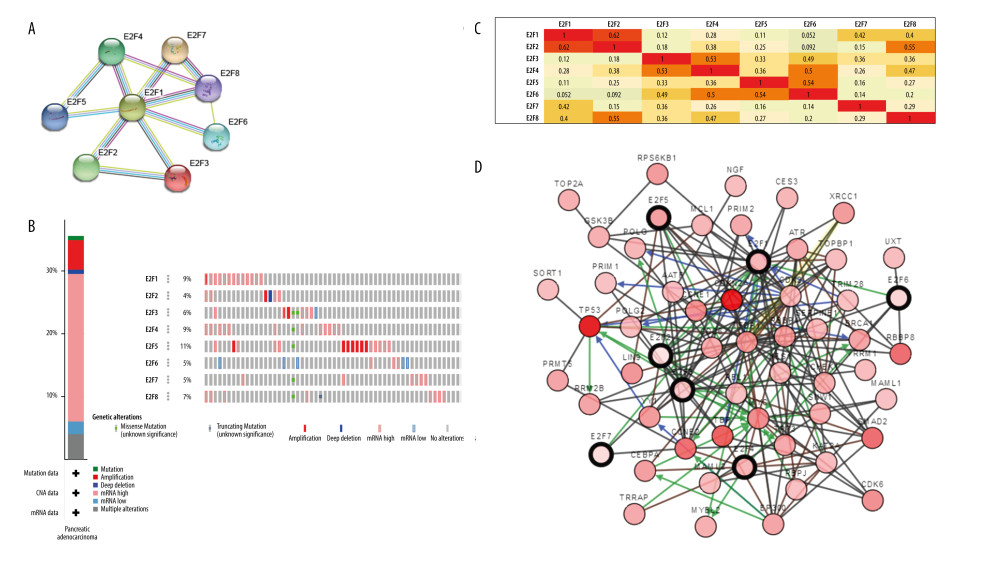 Figure 5. Functional analysis of E2F family members. (A) A PPI network of E2F family TFs expressed in PAAD was constructed with the STRING tool. (B) An analysis of E2F family protein expression and mutations in PAAD patients was conducted using cBioPortal. (C) The GEPIA database was used to conduct an E2F family member coexpression analysis in PAAD. (D) An E2F pathway analysis was performed using cBioPortal.
 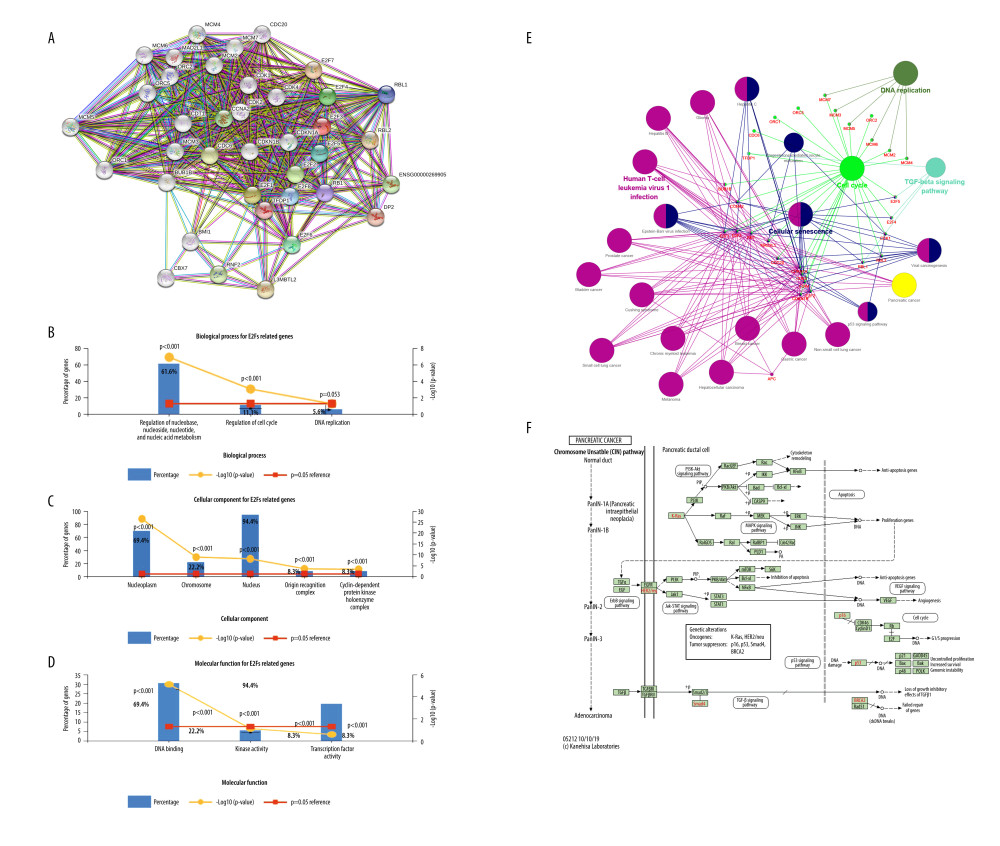 Figure 6. Functional analyses of E2F-related proteins in PAAD. (A) E2Fs and the top 30 E2F-related interacting proteins were incorporated into a PPI network generated using the STRING tool. (B–D) GO enrichment analyses for these 38 E2F family members and related proteins were conducted with the FUNRICH tool. (E) KEGG pathway enrichment analyses for these 38 E2F family members and related proteins were conducted using the ClueGo plug-in in Cytoscape software. (F) KEGG pathways regulated by E2F family members.
 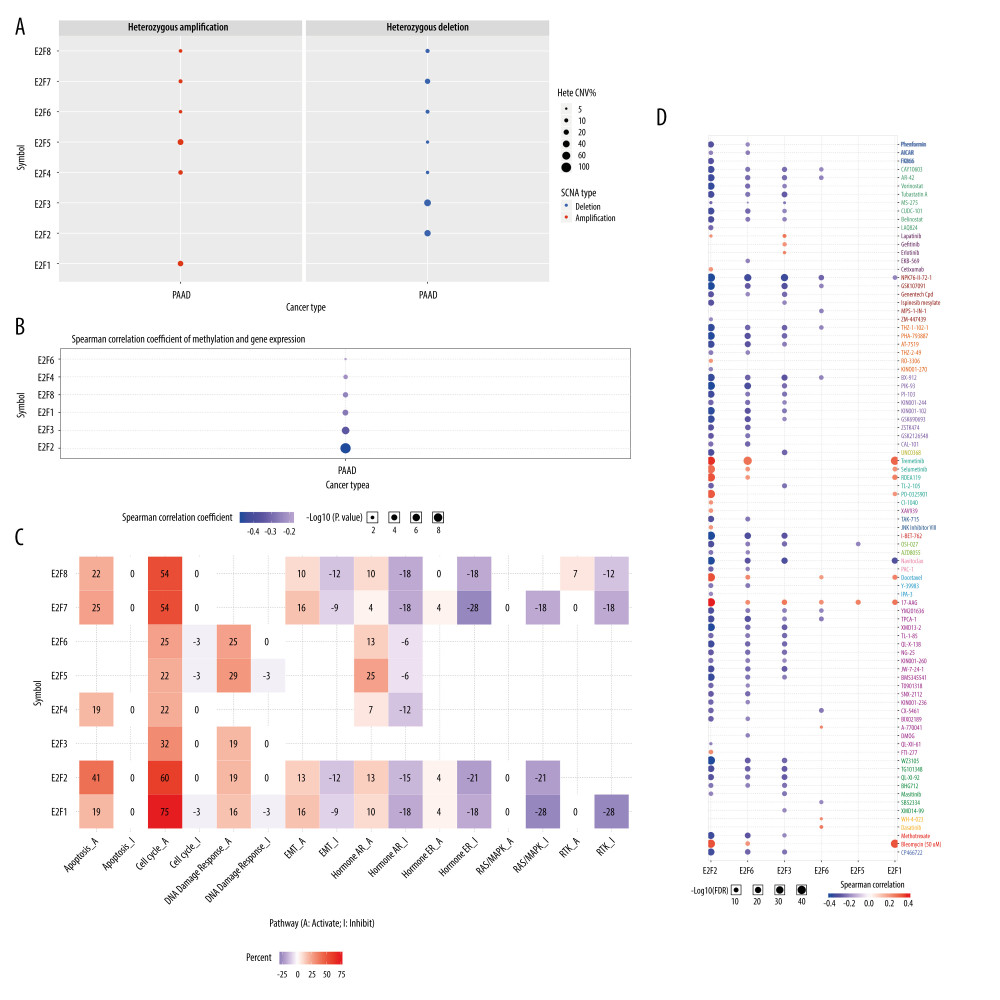 Figure 7. Mutations and functions of E2F family members as analyzed using GSCALite. (A) CNV analysis of E2F family members. (B) Correlations between the methylation of E2F family members and their expression in PAAD. (C) E2F family member-related pathway activity in PAAD. (D) The role of E2F family members in the context of drug sensitivity.
 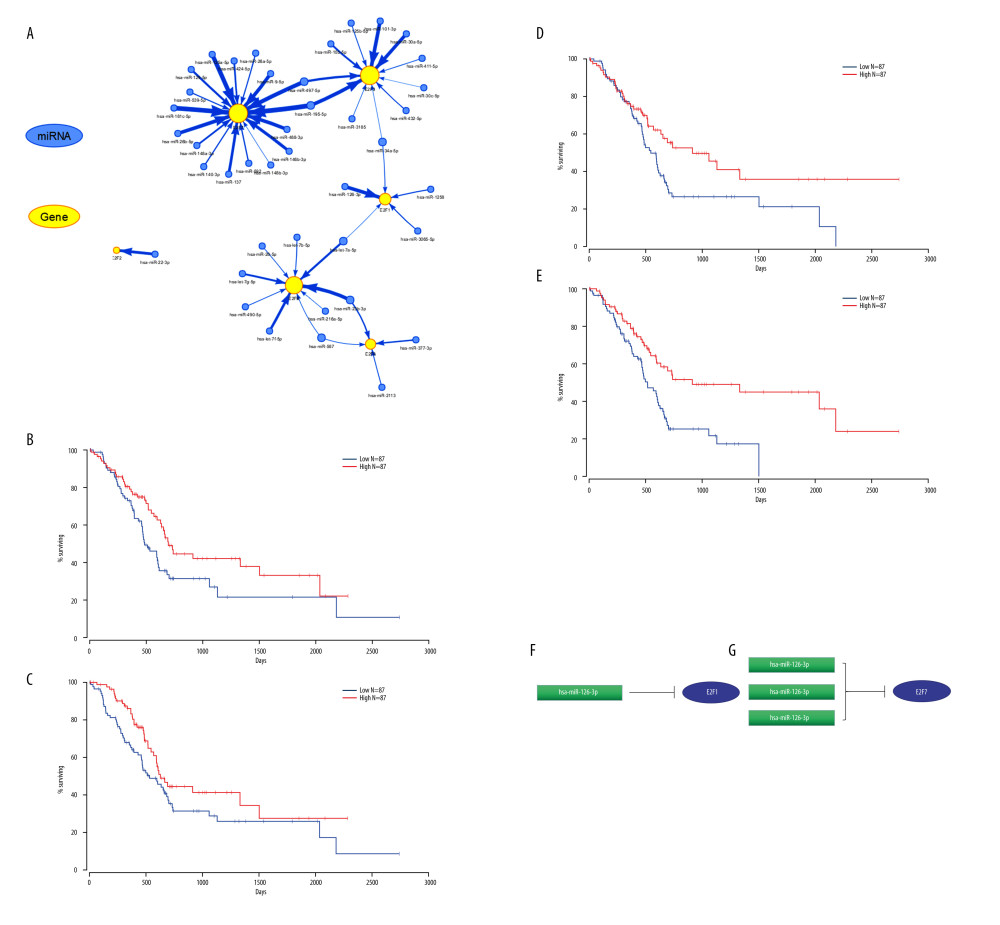 Figure 8. Prognostic analyses of E2F gene-related miRNAs. (A) Survival outcomes associated with miRNAs predicted to regulate E2F family members were assessed with the GSCALite tool. (B, F) Survival outcomes associated with E2F1-related miRNAs were assessed with Oncolnc. (C–E, G) Survival outcomes associated with E2F7-related miRNAs were assessed with Oncolnc.
 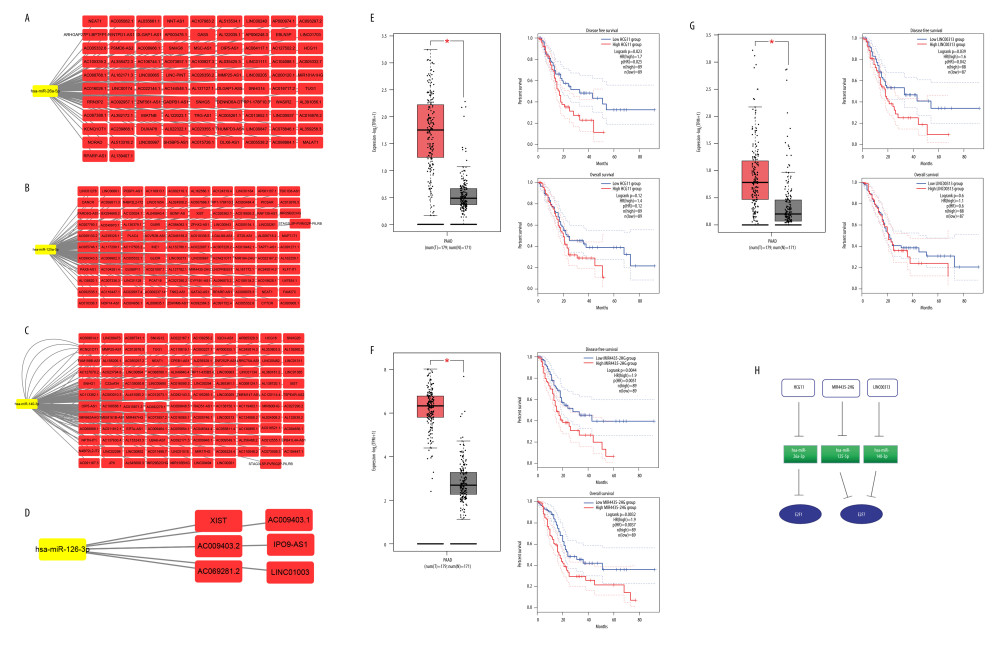 Figure 9. Associations between ceRNA networks and PAAD patient outcomes. (A–D) The Cytoscape tool was used to predict lncRNAs upstream of specific miRNAs of interest. (E–G) The prognostic relevance of putative upstream lncRNAs was assessed. (H) Putative ceRNA (lncRNA/miRNA/mRNA) regulatory relationships identified in the present analysis.
 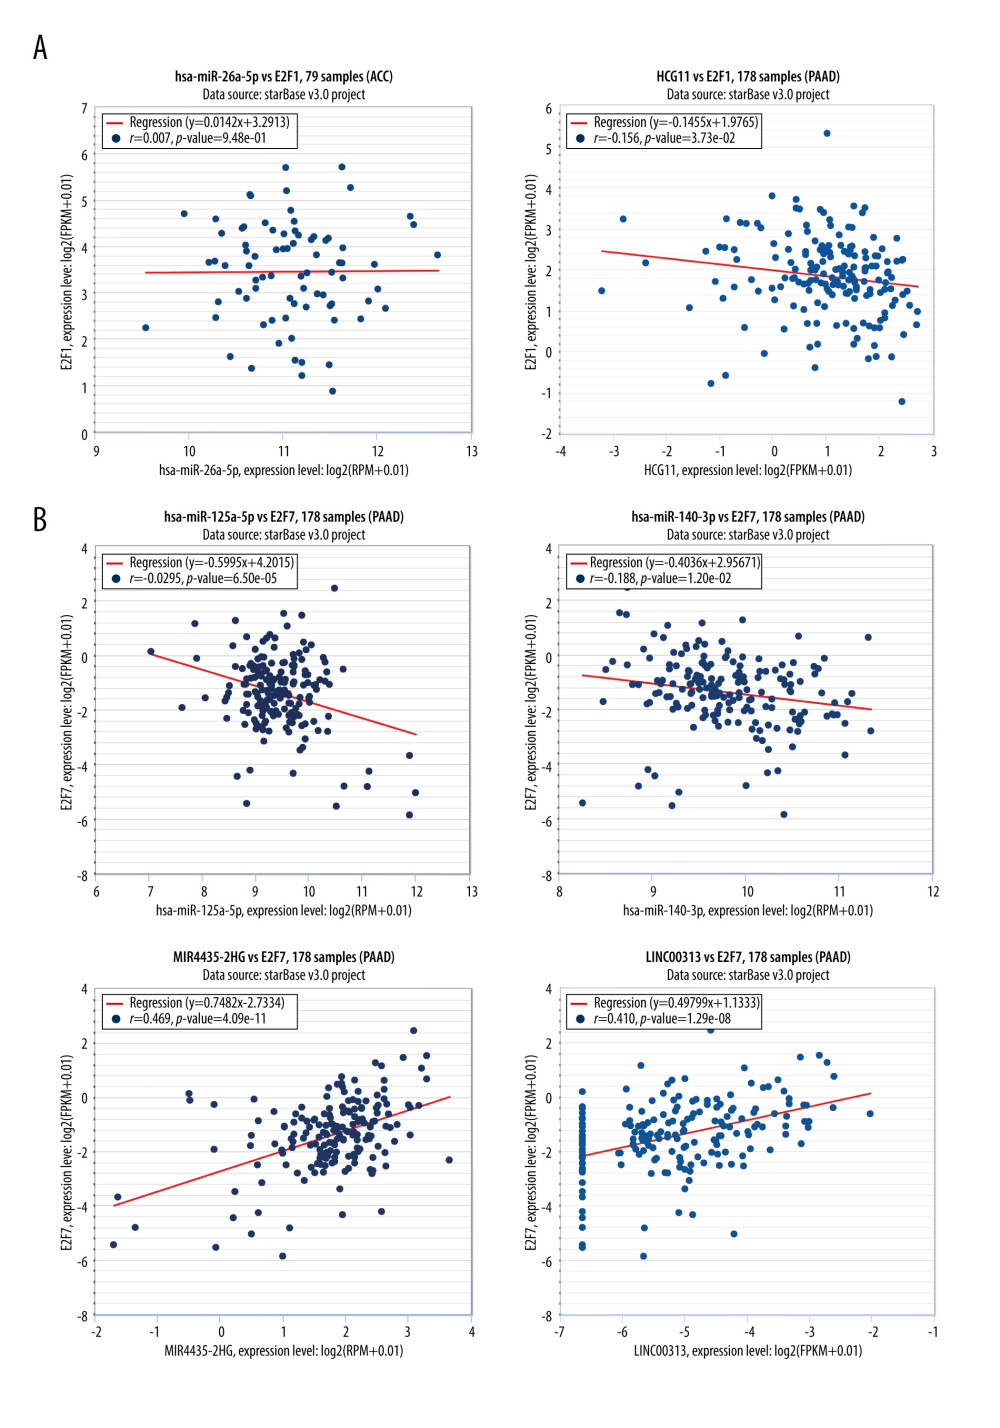 Figure 10. Coexpression analyses of associations between E2F family members and related noncoding RNAs. (A) Coexpression relationship analysis of E2F1/miRNA26a-5p/HCG11 was conducted using the starBase tool. (B) A coexpression relationship analysis of E2F7 and related noncoding RNAs was conducted using the starBase tool.
 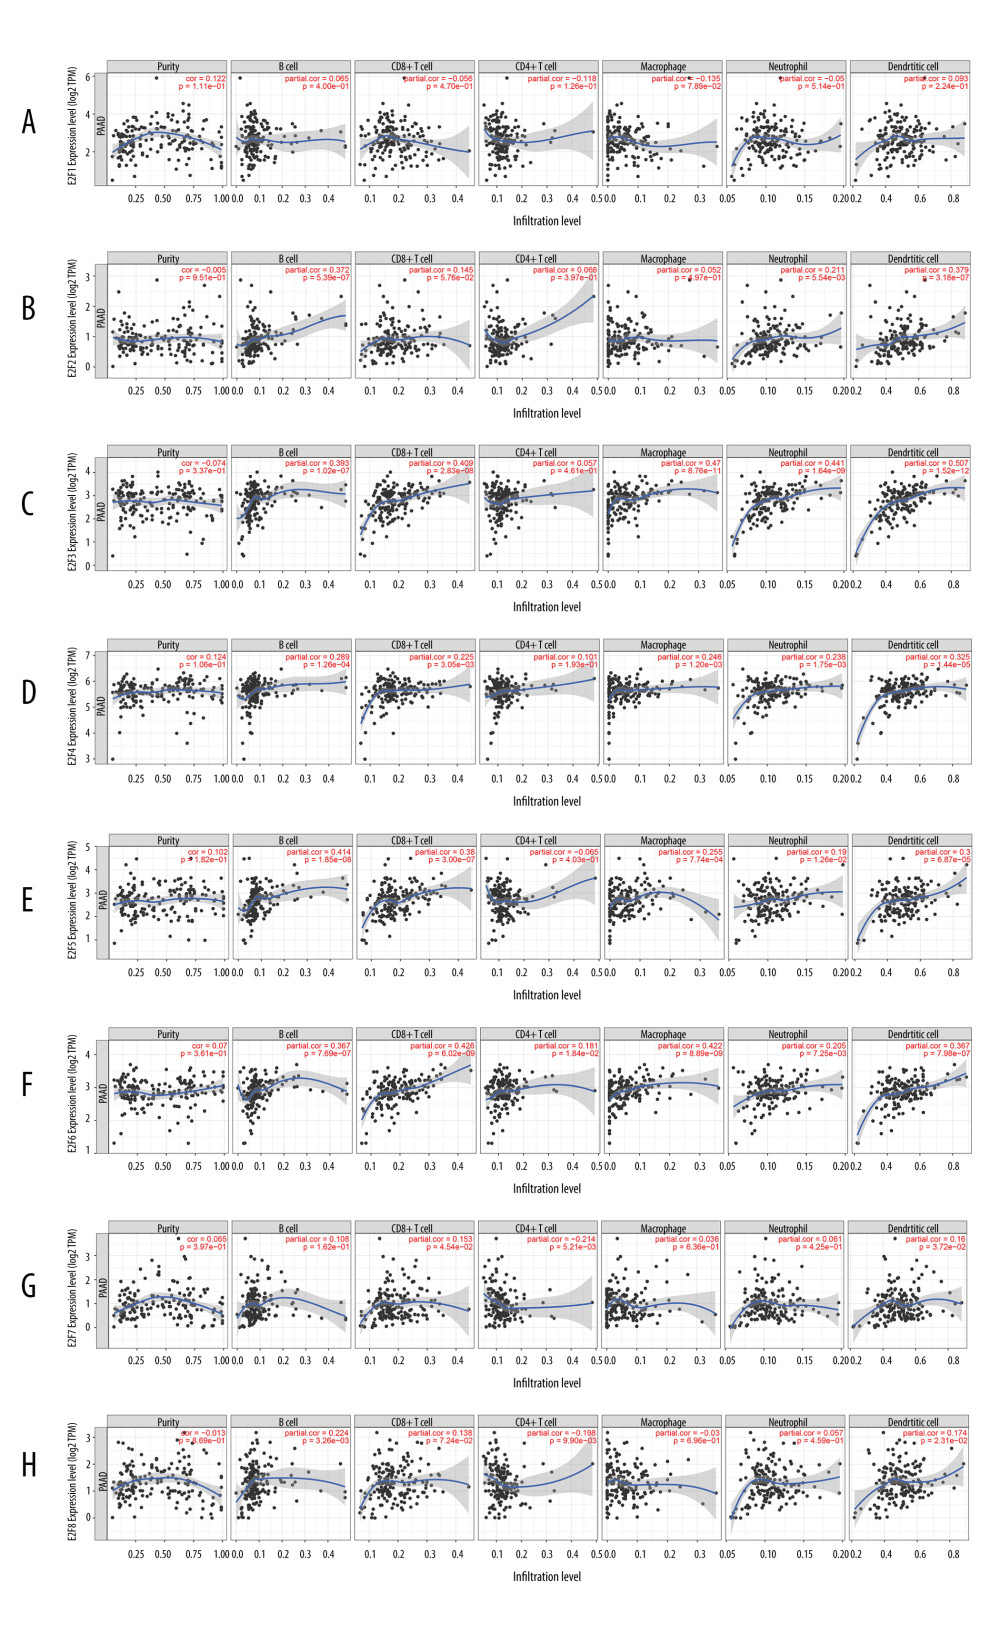 Figure 11. The relationship between E2F expression levels and immune cell infiltration in PAAD (TIMER). The correlation between the abundance of immune cells and the expression of E2F1 (A), E2F2 (B), E2F3 (C), E2F4 (D), E2F5 (E), E2F6 (F), E2F7 (G), and E2F8 (H) in PAAD.
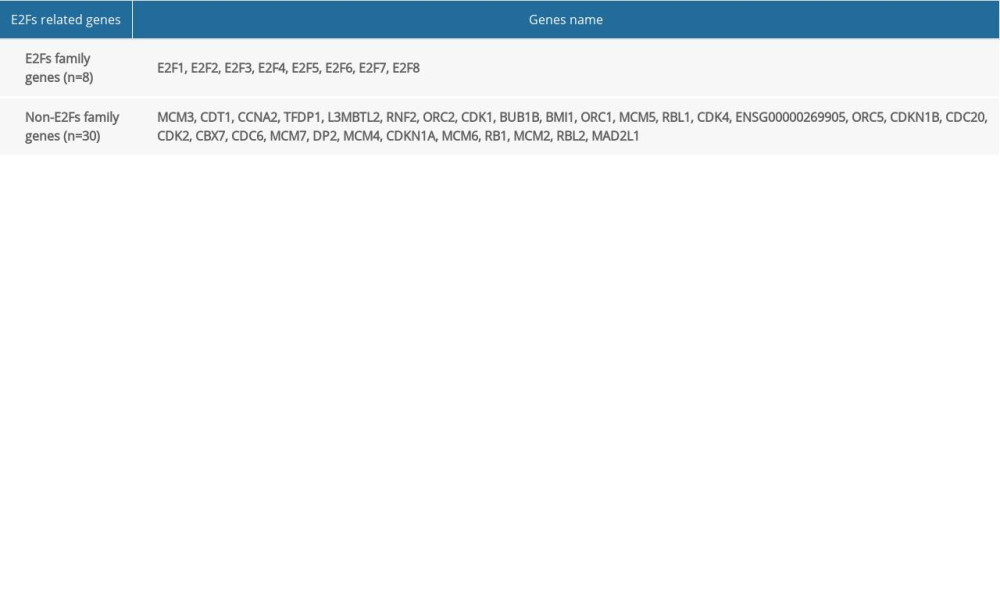
References
1. Rawla P, Sunkara T, Gaduputi V, Epidemiology of pancreatic cancer: Global trends, etiology and risk factors: World J Oncol, 2019; 10(1); 10-27
2. Chen HZ, Tsai SY, Leone G, Emerging roles of E2Fs in cancer: An exit from cell cycle control: Nat Rev Cancer, 2009; 9; 785-97
3. Attwooll C, Denchi EL, Helin K, The E2F family: specific functions and overlapping interests: EMBO J, 2004; 23(24); 4709-16
4. Reimer D, Sadr S, Wiedemair A, Expression of the E2F family of transcription factors and its clinical relevance in ovarian cancer: Ann NY Acad Sci, 2010; 1091(1); 270-81
5. Sun C, Li S, Hu W, Comprehensive analysis of the expression and prognosis for E2Fs in human breast cancer: Mol Ther J Am Soc Gene Ther, 2019; 27(6); 1153-65
6. Santos M, Dueñas M, Garcíaescudero R, In vivo disruption of an Rb-E2FEzh2 signaling loop causes bladder cancer: Cancer Res, 2014; 74(22); 6565-77
7. Kaseb AO, Chinnakannu K, Chen D, Androgen receptor – and E2F-1 – targeted thymoquinone therapy for hormone-refractory prostate cancer: Cancer Res, 2007; 67(16); 7782-88
8. Chen L, Kurtyka CA, Welsh EA, Early2 factor (E2F) deregulation is a prognostic and predictive biomarker in lung adenocarcinoma: Oncotarget, 2016; 7(50); 82254-65
9. Sun F, Lin Y, Li S, Gao J, MiR-210 knockdown promotes the development of pancreatic cancer via upregulating E2F3 expression: Eur Rev Med Pharmaco, 2018; 22(24); 8640-48
10. Rhodes DR, Kalyana-Sundaram S, Mahavisno V, Oncomine 3.0: Genes, pathways, and networks in a collection of 18,000 cancer gene expression profiles: Neoplasia (New York NY), 2007; 9(2); 166-80
11. Li T, Fan J, Wang B, TIMER: A web server for comprehensive analysis of tumor-infiltrating immune cells: Cancer Res, 2017; 77(21); e108-10
12. Tang Z, Li C, Kang B, GEPIA: A web server for cancer and normal gene expression profiling and interactive analyses: Nucleic Acids Res, 2017; 45(W1); W98-102
13. Gyorffy B, Surowiak P, Budczies J, Lanczky A, Online survival analysis software to assess the prognostic value of biomarkers using transcriptomic data in non-small-cell lung cancer: PLoS One, 2013; 8(12); e82241
14. Nagy A, Lanczky A, Menyhart O, Gyorffy B, Validation of miRNA prognostic power in hepatocellular carcinoma using expression data of independent datasets: Sci Rep UK, 2018; 8(1); 9227
15. Tomczak K, Czerwinska P, Wiznerowicz M, Review The Cancer Genome Atlas (TCGA): An immeasurable source of knowledge: Contemp Onkol (Pozn), 2015; 19(1A); A68-77
16. Gao J, Aksoy BA, Dogrusoz U, Integrative analysis of complex cancer genomics and clinical profiles using the cBioPortal: Sci Signal, 2013; 6(269); pl1
17. Cerami E, Gao J, Dogrusoz U, The cBio cancer genomics portal: An open platform for exploring multidimensional cancer genomics data: Cancer Discov, 2012; 2(5); 401-4
18. Szklarczyk D, Gable AL, Lyon D, STRING v11: Protein–protein association networks with increased coverage, supporting functional discovery in genome-wide experimental datasets: Nucleic Acids Res, 2019; 47(D1); D607-13
19. Liu CJ, Hu FF, Xia MX, GSCALite: A web server for gene set cancer analysis: Bioinformatics, 2018; 34(21); 3771-72
20. Li JH, Liu S, Zhou H, starBase v2.0: Decoding miRNA-ceRNA, miRNA-ncRNA and protein-RNA interaction networks from large-scale CLIP-Seq data: Nucleic Acids Res, 2014; 42(Database issue); D92-97
21. Ye S, Yang L, Zhao X, Bioinformatics method to predict two regulation mechanism: TF miRNA-mRNA and lncRNA-miRNA-mRNA in pancreatic cancer: Cell Biochem Biophys, 2014; 70(3); 1849-58
22. Jiang H, Martin V, Alonso M, RB-E2F1: molecular rheostat for autophagy and apoptosis: Autophagy, 2010; 6(8); 1216-17
23. Ma L, Tian X, Wang F, The long noncoding RNA H19 promotes cell proliferation via E2F-1 in pancreatic ductal adenocarcinoma: Cancer Biol Ther, 2016; 17(10); 1051-61
24. Yao Z, Chen Q, Ni Z, Long non-coding RNA Differentiation Antagonizing Nonprotein Coding RNA (DANCR) promotes proliferation and invasion of pancreatic cancer by sponging miR-214-5p to regulate E2F2 expression: Med Sci Monit, 2019; 25; 4544-52
25. Olsson AY, Feber A, Edwards S, Role of E2F3 expression in modulating cellular proliferation rate in human bladder and prostate cancer cells: Oncogene, 2007; 26(7); 1028-37
26. Sun C, Li S, Zhang F, Long noncoding RNA NEAT1 promotes non-small cell lung cancer progression through regulation of miR-377-3p-E2F3 pathway: Oncotarget, 2016; 7; 51784-814
27. Brown KC, Witte TR, Hardman WE, Capsaicin displays anti-proliferative activity against human small cell lung cancer in cell culture and nude mice models via the E2F pathway: PLoS One, 2010; 5; e10243
28. Fang DZ, Wang YP, Liu J, MicroRNA-129-3p suppresses tumor growth by targeting E2F5 in glioblastoma: Eur Rev Med Pharmacol Sci, 2018; 22; 1044-50
29. Li SL, Sui Y, Sun J: Int J Mol Med, 2018; 41; 2429-33
30. Sun CC, Zhou Q, Hu W, Transcriptional E2F1/2/5/8 as potential targets and transcriptional E2F3/6/7 as new biomarkers for the prognosis of human lung carcinoma: Aging (Albany NY), 2018; 10(5); 973-87
31. Carvajal LA, Hamard PJ, Tonnessen C, Manfredi JJ, E2F7, a novel target, is upregulated by p53 and mediates DNA damage-dependent transcriptional repression: Genes Dev, 2012; 26(14); 1533-45
32. Deng Q, Wang Q, Zong WY, E2F8 contributes to human hepatocellular carcinoma via regulating cell proliferation: Cancer Res, 2010; 70; 782-91
Figures
Figure 1. Expression levels of the E2F family of proteins in different cancers. (A–H) E2F family TF expression levels in different cancer types and corresponding normal tissues as assessed with the TIMER database. (I) The transcriptional expression of E2F family members in different cancers and corresponding normal tissues as assessed with the ONCOMINE database.Figure 2. GEPIA-based assessment of E2F protein expression levels in PAAD. (A) Differential E2F protein expression in PAAD and normal tissue samples was assessed using the GEPIA database. (B–I) Box plots were used to demonstrate differences in E2F expression between PAAD and normal tissues in the GEPIA database.Figure 3. (A–H) Correlation between the expression of E2F family proteins and PAAD tumor stage as assessed using GEPIA.Figure 4. (A, B) Evaluation of the prognostic relevance of E2F family TF mRNA expression levels in PAAD patients, as assessed using the Kaplan-Meier Plotter tool.Figure 5. Functional analysis of E2F family members. (A) A PPI network of E2F family TFs expressed in PAAD was constructed with the STRING tool. (B) An analysis of E2F family protein expression and mutations in PAAD patients was conducted using cBioPortal. (C) The GEPIA database was used to conduct an E2F family member coexpression analysis in PAAD. (D) An E2F pathway analysis was performed using cBioPortal.Figure 6. Functional analyses of E2F-related proteins in PAAD. (A) E2Fs and the top 30 E2F-related interacting proteins were incorporated into a PPI network generated using the STRING tool. (B–D) GO enrichment analyses for these 38 E2F family members and related proteins were conducted with the FUNRICH tool. (E) KEGG pathway enrichment analyses for these 38 E2F family members and related proteins were conducted using the ClueGo plug-in in Cytoscape software. (F) KEGG pathways regulated by E2F family members.Figure 7. Mutations and functions of E2F family members as analyzed using GSCALite. (A) CNV analysis of E2F family members. (B) Correlations between the methylation of E2F family members and their expression in PAAD. (C) E2F family member-related pathway activity in PAAD. (D) The role of E2F family members in the context of drug sensitivity.Figure 8. Prognostic analyses of E2F gene-related miRNAs. (A) Survival outcomes associated with miRNAs predicted to regulate E2F family members were assessed with the GSCALite tool. (B, F) Survival outcomes associated with E2F1-related miRNAs were assessed with Oncolnc. (C–E, G) Survival outcomes associated with E2F7-related miRNAs were assessed with Oncolnc.Figure 9. Associations between ceRNA networks and PAAD patient outcomes. (A–D) The Cytoscape tool was used to predict lncRNAs upstream of specific miRNAs of interest. (E–G) The prognostic relevance of putative upstream lncRNAs was assessed. (H) Putative ceRNA (lncRNA/miRNA/mRNA) regulatory relationships identified in the present analysis.Figure 10. Coexpression analyses of associations between E2F family members and related noncoding RNAs. (A) Coexpression relationship analysis of E2F1/miRNA26a-5p/HCG11 was conducted using the starBase tool. (B) A coexpression relationship analysis of E2F7 and related noncoding RNAs was conducted using the starBase tool.Figure 11. The relationship between E2F expression levels and immune cell infiltration in PAAD (TIMER). The correlation between the abundance of immune cells and the expression of E2F1 (A), E2F2 (B), E2F3 (C), E2F4 (D), E2F5 (E), E2F6 (F), E2F7 (G), and E2F8 (H) in PAAD. In Press
05 Mar 2024 : Clinical Research
Role of Critical Shoulder Angle in Degenerative Type Rotator Cuff Tears: A Turkish Cohort StudyMed Sci Monit In Press; DOI: 10.12659/MSM.943703
06 Mar 2024 : Clinical Research
Comparison of Outcomes between Single-Level and Double-Level Corpectomy in Thoracolumbar Reconstruction: A ...Med Sci Monit In Press; DOI: 10.12659/MSM.943797
21 Mar 2024 : Meta-Analysis
Economic Evaluation of COVID-19 Screening Tests and Surveillance Strategies in Low-Income, Middle-Income, a...Med Sci Monit In Press; DOI: 10.12659/MSM.943863
10 Apr 2024 : Clinical Research
Predicting Acute Cardiovascular Complications in COVID-19: Insights from a Specialized Cardiac Referral Dep...Med Sci Monit In Press; DOI: 10.12659/MSM.942612
Most Viewed Current Articles
17 Jan 2024 : Review article
Vaccination Guidelines for Pregnant Women: Addressing COVID-19 and the Omicron VariantDOI :10.12659/MSM.942799
Med Sci Monit 2024; 30:e942799
14 Dec 2022 : Clinical Research
Prevalence and Variability of Allergen-Specific Immunoglobulin E in Patients with Elevated Tryptase LevelsDOI :10.12659/MSM.937990
Med Sci Monit 2022; 28:e937990
16 May 2023 : Clinical Research
Electrophysiological Testing for an Auditory Processing Disorder and Reading Performance in 54 School Stude...DOI :10.12659/MSM.940387
Med Sci Monit 2023; 29:e940387
01 Jan 2022 : Editorial
Editorial: Current Status of Oral Antiviral Drug Treatments for SARS-CoV-2 Infection in Non-Hospitalized Pa...DOI :10.12659/MSM.935952
Med Sci Monit 2022; 28:e935952